
3. Violation Reports
Violation Reports generally refer to compliance or policy violations that an automated scanner identifies. For instance, a daily script might check your codebase or server configurations and log any suspicious results:
- NPM: Could be scanning for vulnerable dependencies in a Node.js project.
- SERVER_SCAN: Might check server configurations, open ports, or outdated libraries.
- SYNC: Another custom tool or integration that reports code or config discrepancies.
Once a violation is “found,” security engineers review it, assign it a State (e.g., “In progress”), and, after investigation, mark it “Resolved” or “Not processed” if it’s a false positive or low priority.
Use Cases
- Updating Vulnerable Dependencies
A daily NPM scan detects outdated packages in a Node.js project. Engineers mark the report as "In progress", update the dependencies, and resolve the issue.
- Server Configuration Errors
A SERVER_SCAN identifies open ports. The IT team secures the ports and marks the violation as "Resolved".
- Sync Discrepancies
A SYNC scan flags code inconsistencies after deployment. Developers review the logs, sync configurations, and close the report.
- False Positives Management
An automated scan reports a minor issue. The security team reviews the report and marks it as "Not processed" if deemed harmless.
Typical Workflow
1. Daily/Periodic Scans
A security scanner (via API integration, not by default) runs on a server or code repository on a set schedule, reporting:
"notFound" – No issues detected.
"found" – Issues identified for review.
2. Report Creation
The system automatically creates a Violation Report entry, or a security engineer manually logs it.
Fields include:
- Server name: Which server was scanned.
- Tool: Name of the scanning tool (e.g., NPM, SERVER_SCAN, SYNC).
- Result: Was a violation discovered (found) or not?
- State: Whether the issue is “Not processed,” “In progress,” or “Resolved.”
- Project: Which project or environment the server is linked to.
- Created at/Updated at: Timestamps for when the record was created or last updated.
- Description: Any extra details or logs from the scan.
3. Engineer Review
A security engineer checks the new violations.
If the issue needs action, they mark it as “In progress.”
Once it’s handled or deemed harmless, they set State to “Processed” (or a similar status).
Key Components
Table View
Columns Displayed:
- Server name – Identifier of the scanned host.
- Tool – Scanner used (e.g., NPM, SERVER_SCAN, SYNC).
- Result – Violation detected? (Found / Not found).
- Project – Associated project or environment.
- Created at / Updated at – Timestamps.
- State – Processing status (Not processed, In progress, Resolved).
- Actions – ✏️ Edit icon to open the details panel.
Sorting & Total:
Sort reports by any column. The Total count shows how many entries match your current view.
Adding a Violation Report
To log a new compliance or policy violation:
1. Open the Add Form
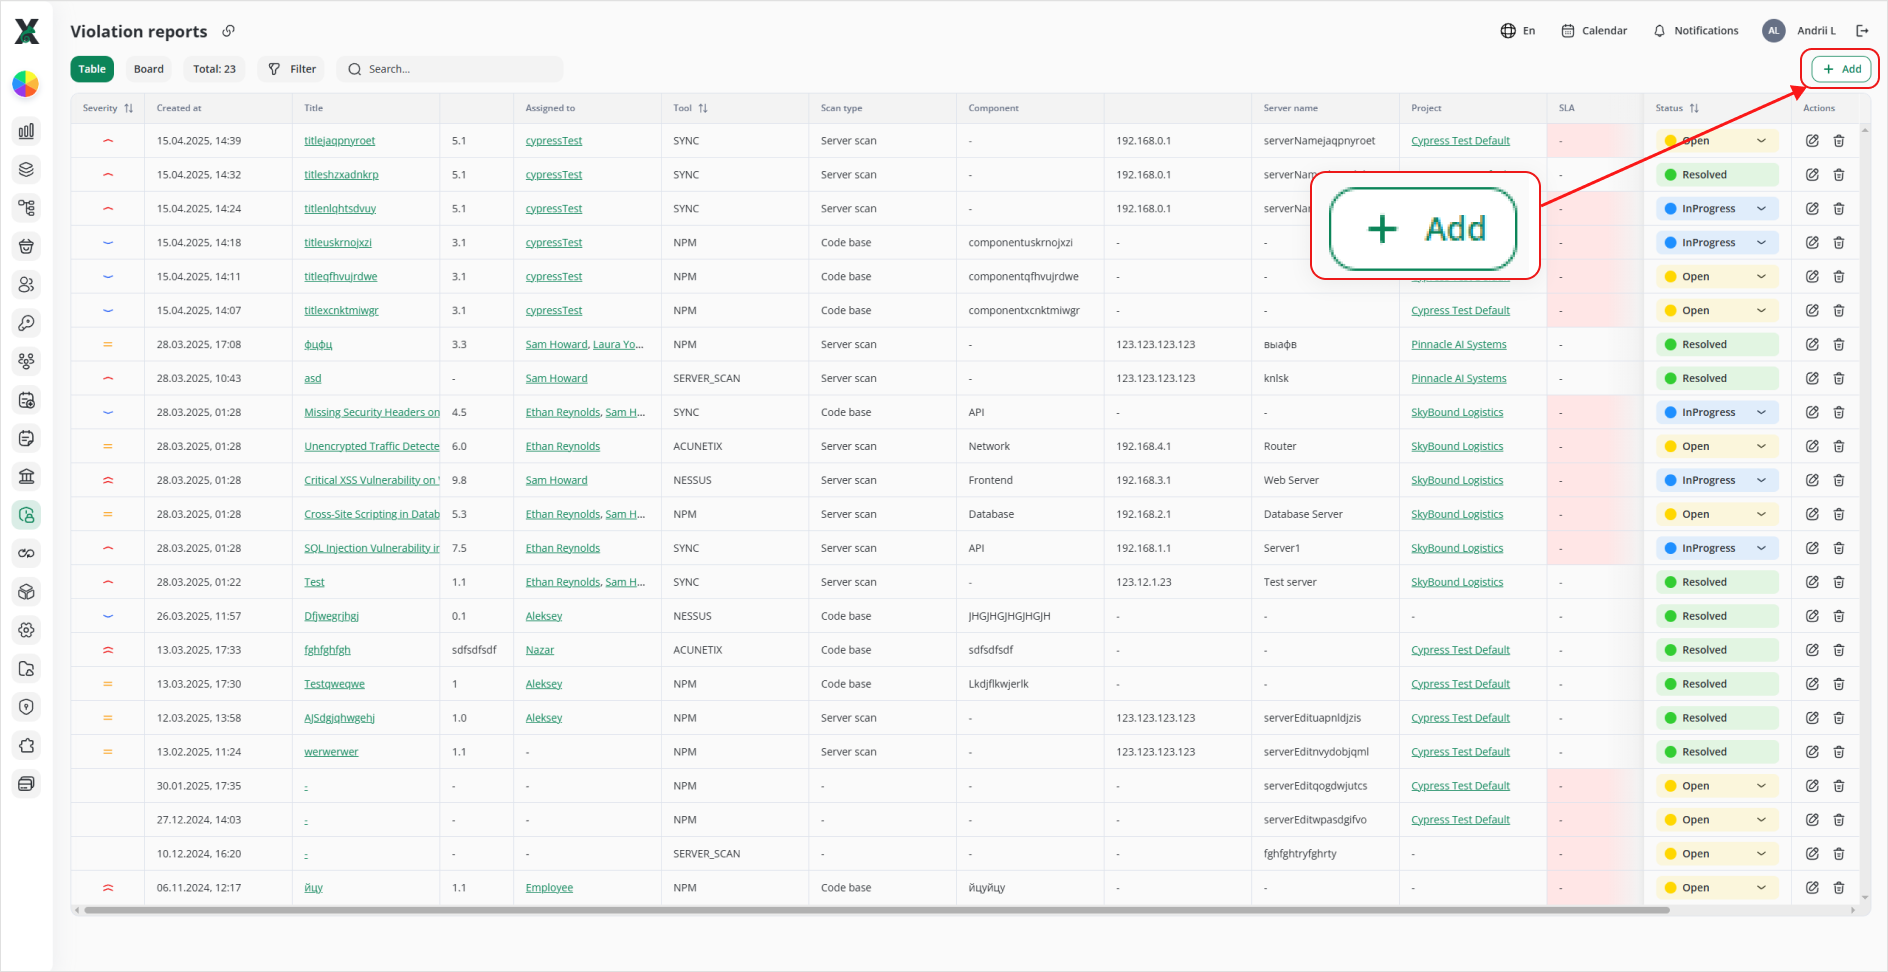
Click the green + Add button in the top-right corner of the Violation reports table.
2. Fill in the Report Details
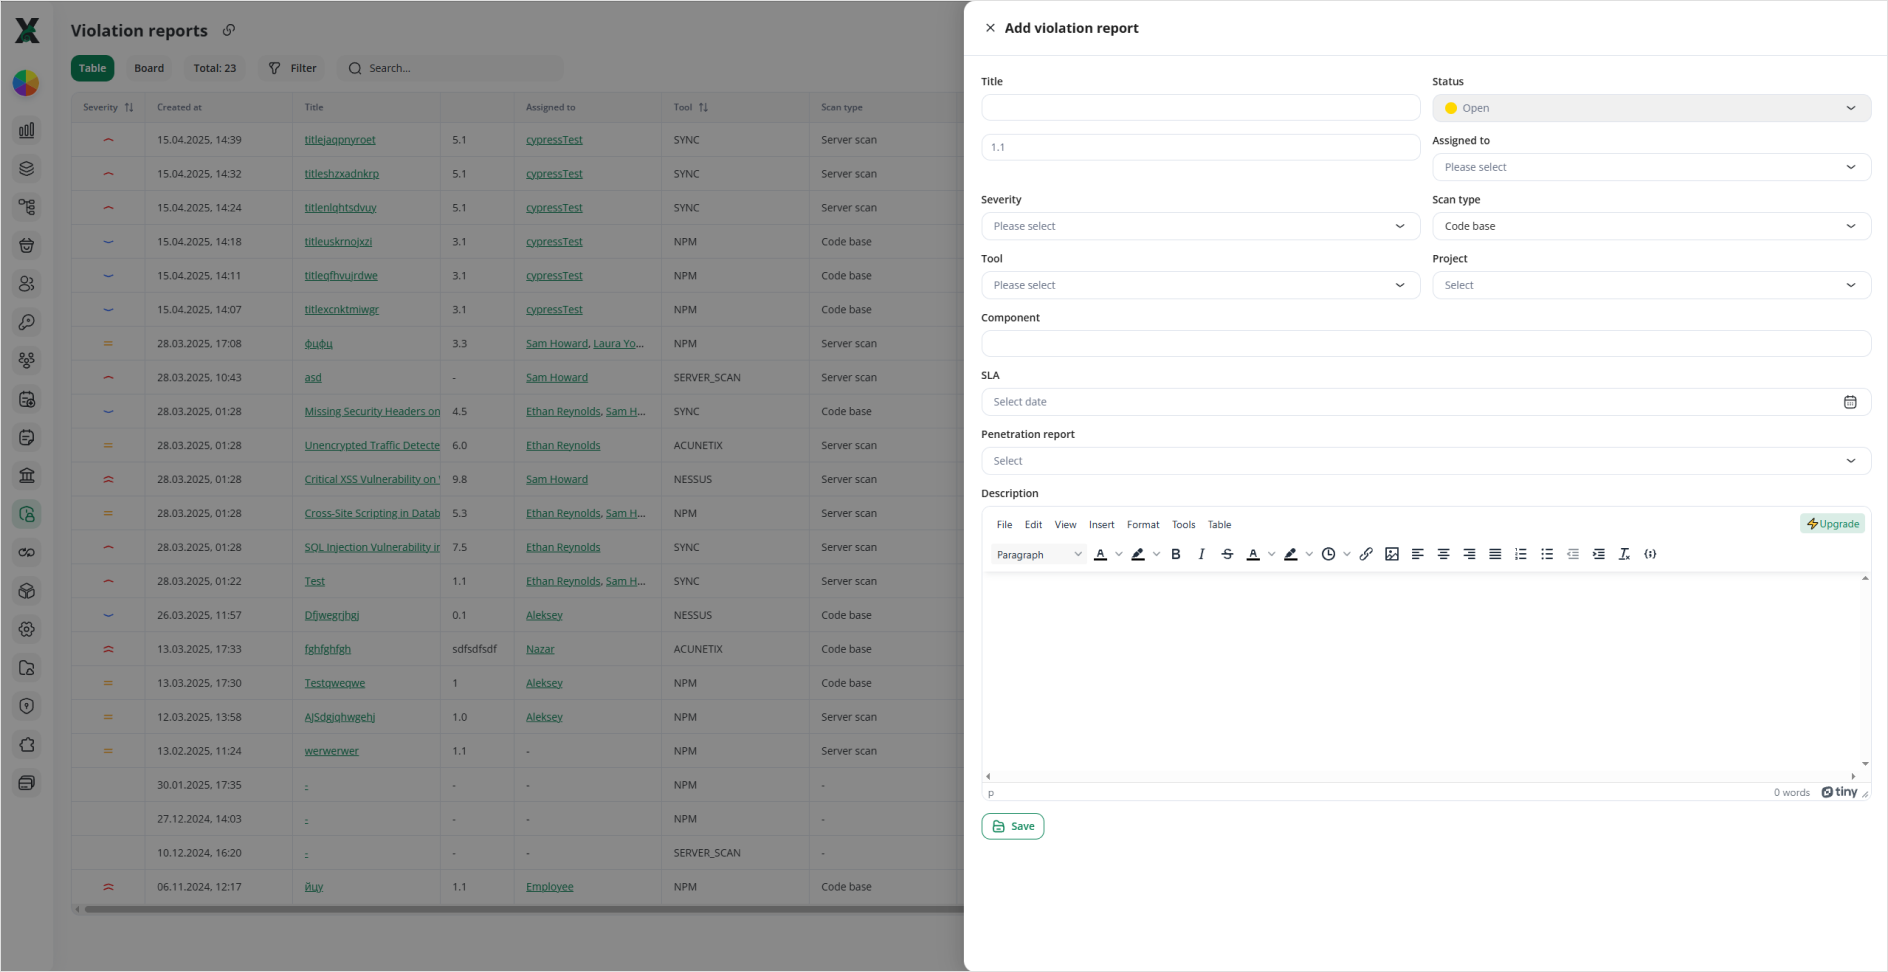
In the “Add violation report” side panel, complete the following fields:
3. Save the Report
When all mandatory fields are populated, click Save to create the new Violation Report.
The report will now appear in your table (and board) views, ready for review and triage.
Enhanced Capture & Closure Workflow
1. Additional Fields on the “Add Violation Report” Form
When you click + Add (top-right of the report table), you’ll still enter Project, Title, Description, etc. — but now you must supply:
CVSS v3 Score: A numeric value (e.g. 7.5) indicating the vulnerability’s severity on the CVSS scale.
Severity: A dropdown (Low / Medium / High / Critical) that maps to your CVSS thresholds.
Tool: The scanner or pen-test tool that generated this report (e.g. NPM, OWASP ZAP, Burp Suite).
Scan Type: Codebase or Server Scan.
If Codebase is selected: an additional Component free-text field appears (e.g. the repo path or module name).
If Server Scan is selected: two fields appear—Server IP (e.g. 192.0.2.15) and Server Hostname (e.g. api-prod-01.example.com).
All other fields and the rich-text Description editor remain the same.
2. “Processed” → Close-With-Summary Modal
Once a report is fixed or verified, you’ll mark its State as Processed. At that moment:
- Trigger
Changing State to Processed immediately opens a Close Report dialog.
- Modal Contents
A read-only summary of every field you filled (Project, Title, CVSS, Severity, Tool, Scan Type + Component/Server, Description).
A new Summary textarea (required) where you capture resolution details, verification steps, or final notes.
- Save & Finalize
Click Save in the modal to store the Summary and set the report’s status to Processed.
The Summary is then visible in the report’s detail view and recorded in the audit trail for future reference.
With these additions, every Violation Report captures structured risk data upfront and ensures that closing a report always includes a clear, documented resolution.
Editing a Violation Report
1. Locate the record
In Table view, scroll or search to find the row for the violation you want to update.
In Board view, find the card in its status column.
2. Open the edit form
- Table: Click the Edit (✏️) icon in the Actions column.
- Board: Hover over the card and click the pencil icon or the “⋯” menu, then choose Edit.
3. Make your changes
In the side-panel form you can update any field:
- Status (Open, In Progress, Resolved, etc.)
- Severity
- Assigned to
- Scan type, Tool, Component, Server name
- SLA, Penetration report
- Description (detailed notes or logs)
4. Save
Click Save at the bottom of the panel to apply your edits.
Deleting a Violation Report
-
Find the violation
In Table view, locate the row you wish to delete. -
Click the trash icon
Click the Delete (🗑️) icon in the Actions column for that row. -
Confirm deletion
In the confirmation dialog, click Delete again to permanently remove the report
Warning: Deleted violation reports cannot be restored. Be sure you no longer need the record before confirming deletion.
Filtering & Searching
-
Filter Panel:
Click Filter to narrow by State or Tool. -
Search Bar:
Type a partial or full server name in the Search field to find specific reports instantly.