
3. Violation Reports
Violation Reports generally refer to compliance or policy violations that an automated scanner identifies. For instance, a daily script might check your codebase or server configurations and log any suspicious results:
- NPM: Could be scanning for vulnerable dependencies in a Node.js project.
- SERVER_SCAN: Might check server configurations, open ports, or outdated libraries.
- SYNC: Another custom tool or integration that reports code or config discrepancies.
Once a violation is “found,” security engineers review it, assign it a State (e.g., “In progress”), and, after investigation, mark it “Resolved” or “Not processed” if it’s a false positive or low priority.
Use Cases
- Updating Vulnerable Dependencies
A daily NPM scan detects outdated packages in a Node.js project. Engineers mark the report as "In progress", update the dependencies, and resolve the issue.
- Server Configuration Errors
A SERVER_SCAN identifies open ports. The IT team secures the ports and marks the violation as "Resolved".
- Sync Discrepancies
A SYNC scan flags code inconsistencies after deployment. Developers review the logs, sync configurations, and close the report.
- False Positives Management
An automated scan reports a minor issue. The security team reviews the report and marks it as "Not processed" if deemed harmless.
Typical Workflow
1. Daily/Periodic Scans
A security scanner (via API integration, not by default) runs on a server or code repository on a set schedule, reporting:
"notFound" – No issues detected.
"found" – Issues identified for review.
2. Report Creation
The system automatically creates a Violation Report entry, or a security engineer manually logs it.
Fields include:
- Server name: Which server was scanned.
- Tool: Name of the scanning tool (e.g., NPM, SERVER_SCAN, SYNC).
- Result: Was a violation discovered (found) or not?
- State: Whether the issue is “Not processed,” “In progress,” or “Resolved.”
- Project: Which project or environment the server is linked to.
- Created at/Updated at: Timestamps for when the record was created or last updated.
- Description: Any extra details or logs from the scan.
3. Engineer Review
A security engineer checks the new violations.
If the issue needs action, they mark it as “In progress.”
Once it’s handled or deemed harmless, they set State to “Processed” (or a similar status).
Key Components
Table View
Columns Displayed:
- Server name – Identifier of the scanned host.
- Tool – Scanner used (e.g., NPM, SERVER_SCAN, SYNC).
- Result – Violation detected? (Found / Not found).
- Project – Associated project or environment.
- Created at / Updated at – Timestamps.
- State – Processing status (Not processed, In progress, Resolved).
- Actions – ✏️ Edit icon to open the details panel.
Sorting & Total:
Sort reports by any column. The Total count shows how many entries match your current view.
Adding a Violation Report
To log a new compliance or policy violation:
1. Open the Add Form
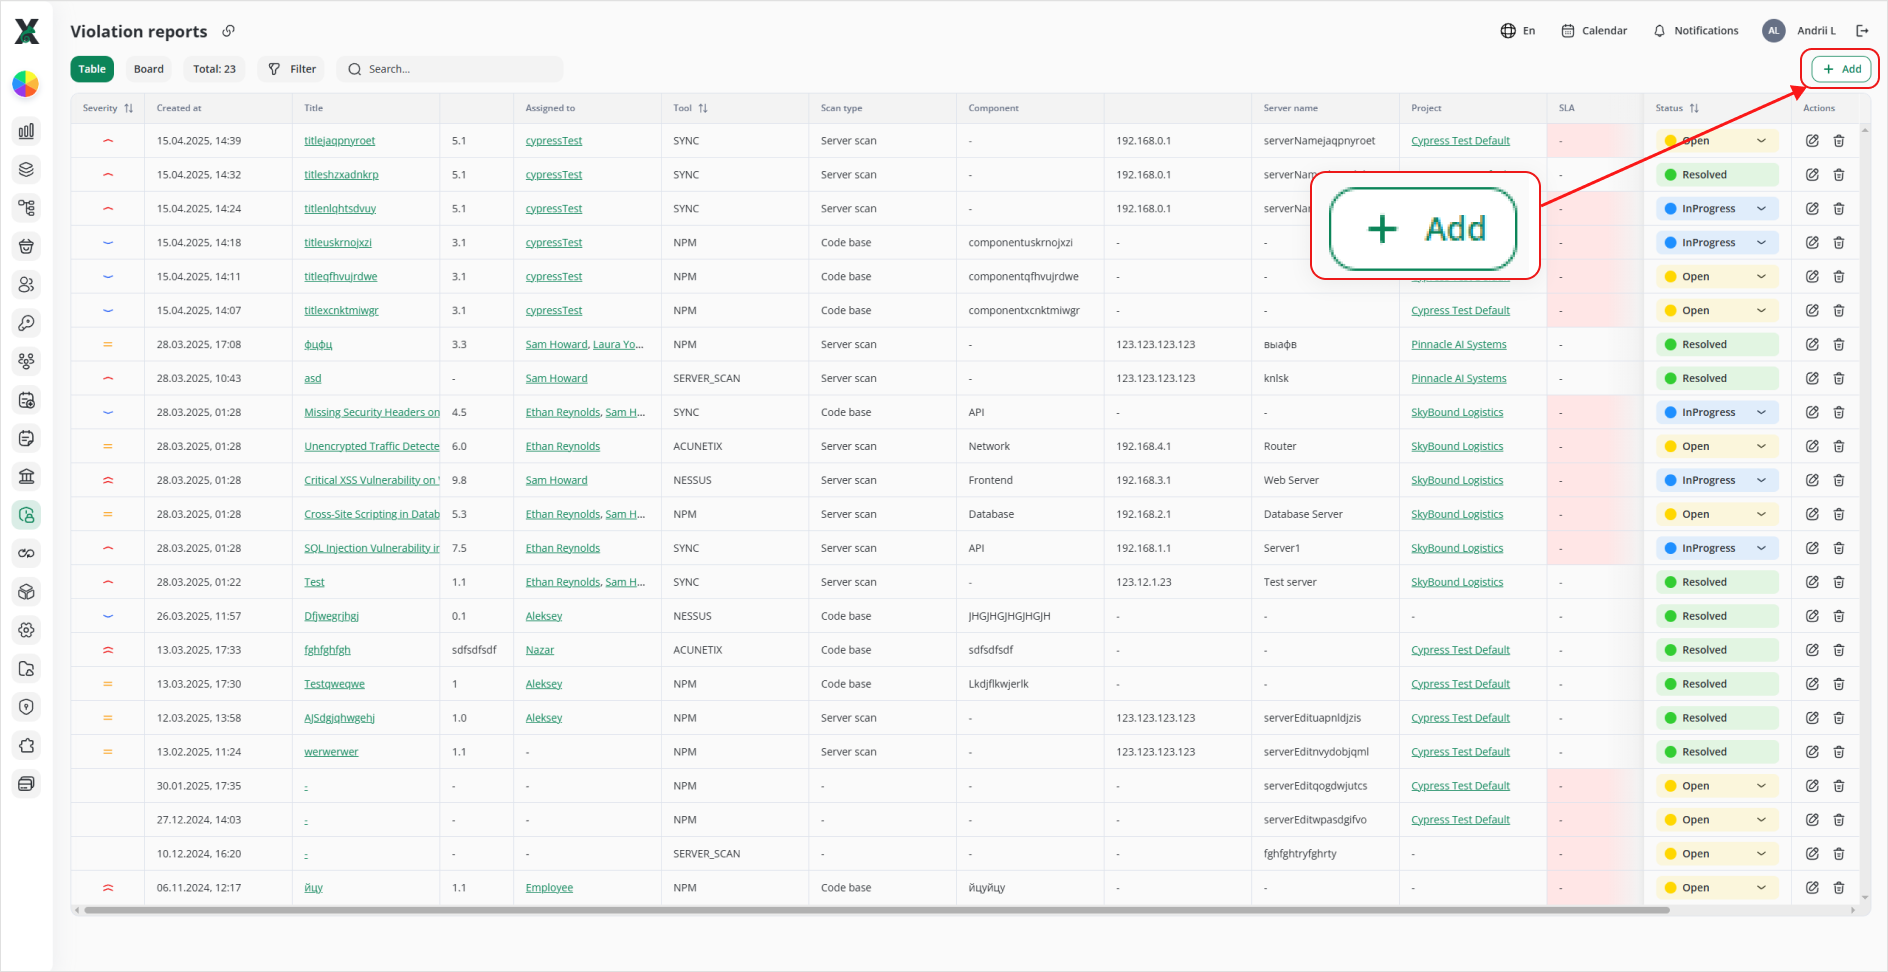
Click the green + Add button in the top-right corner of the Violation reports table.
2. Fill in the Report Details

In the “Add violation report” side panel, complete the following fields:
The report will now appear in your table (and board) views, ready for review and triage.
Edit Violation Report
Fields Available:
- Server name – Free text.
- Tool – Dropdown of registered scanners (SYNC, NPM, SERVER_SCAN).
- Result – Checkbox for “Found.”
- State – Dropdown: Not processed / In progress / Resolved.
- Description – Detailed notes or scan logs.
- Save – Persist changes.
Filtering & Searching
-
Filter Panel:
Click Filter to narrow by State or Tool. -
Search Bar:
Type a partial or full server name in the Search field to find specific reports instantly.