
3. Pipelines
Use the Pipelines page to connect your external CI/CD systems (like Jenkins) and view build runs alongside your security reports.
Use Cases
- Accessing Pipelines
-
Tracking Runs
Once your integration is set up, build runs or jobs from your external CI system (e.g., Jenkins) will appear in Runs, displaying execution history, statuses, and timestamps.
-
Future Expansions
If integrating another CI/CD platform (e.g., GitLab CI, Travis CI), simply provide the API keys and URLs to extend platform compatibility and manage builds seamlessly.
Automation
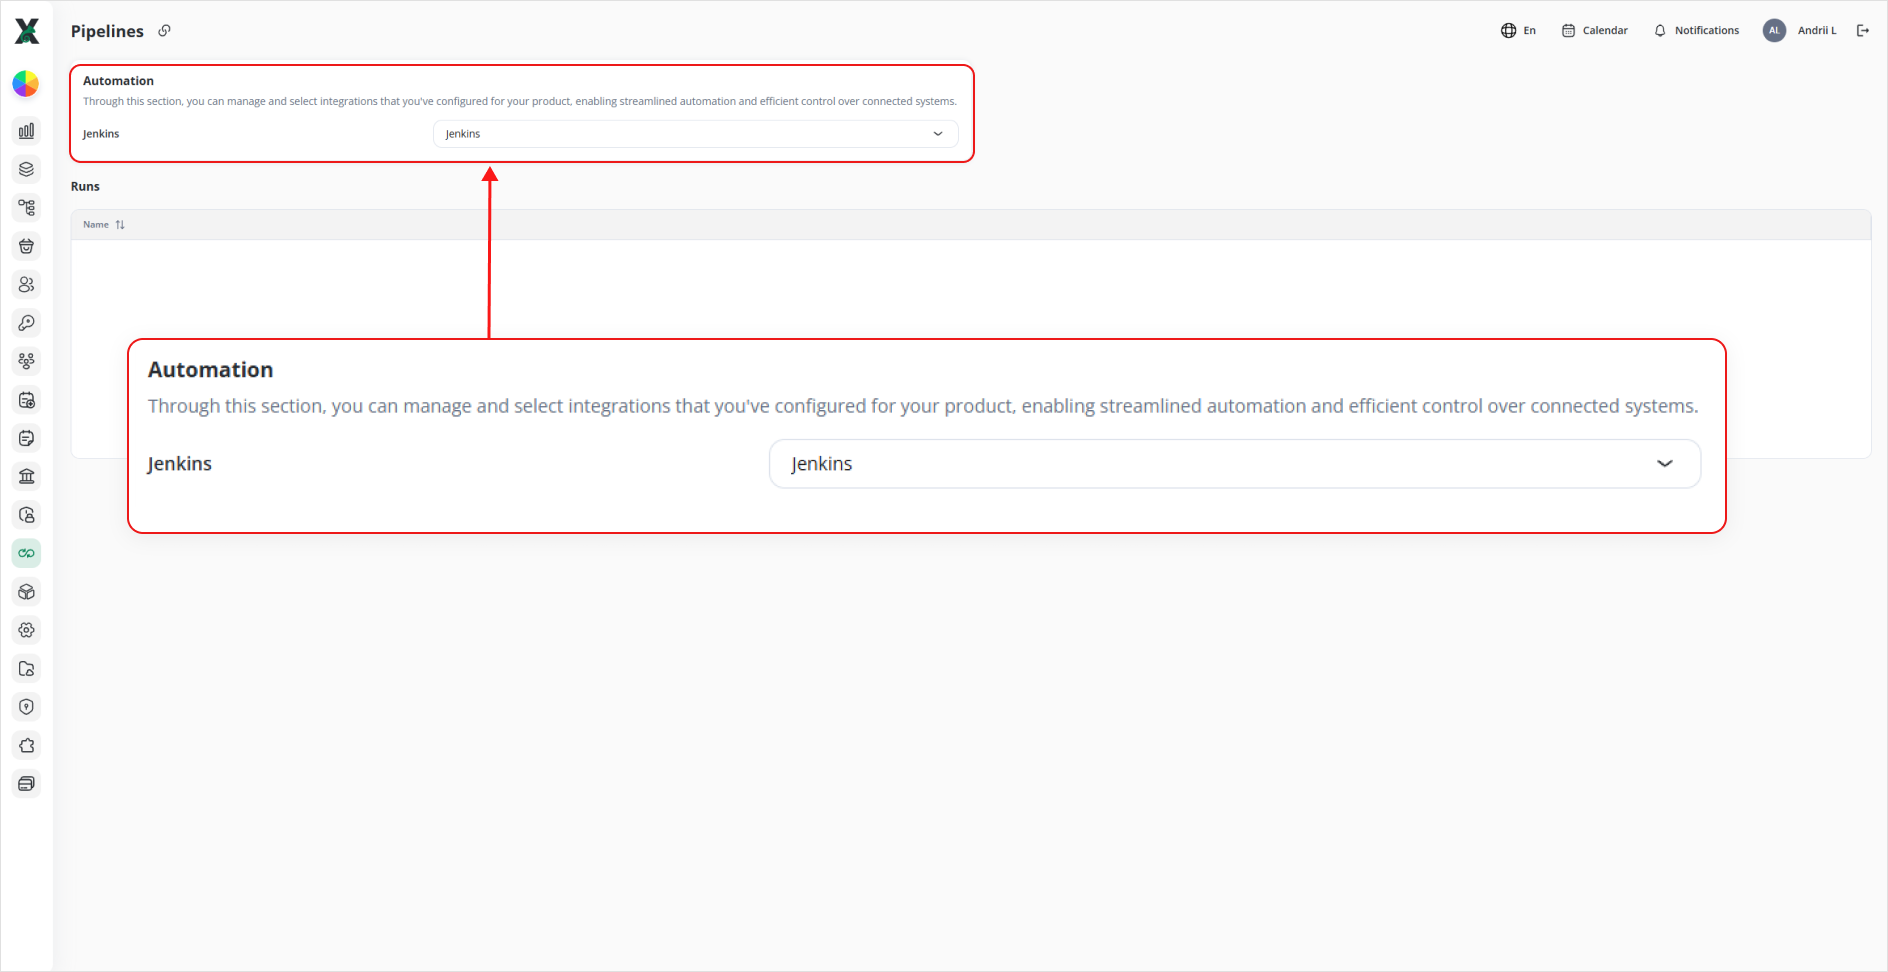
Through this section, you can manage and select integrations that you’ve configured for your product—enabling streamlined automation and efficient control over connected systems.
-
Automation dropdown: lists all CI/CD integrations you’ve set up.
-
Select Jenkins (or another tool) to start pulling in build data.
Runs
Once an integration is selected, this table populates with your pipeline executions:
-
Name ⇅: the identifier of each pipeline or job.
-
Status: success, failure, in-progress, etc.
-
Start / Finish Timestamps: when each run began and ended.
-
Duration: total build time.
If you haven’t run any builds yet, you’ll see:
No data to display
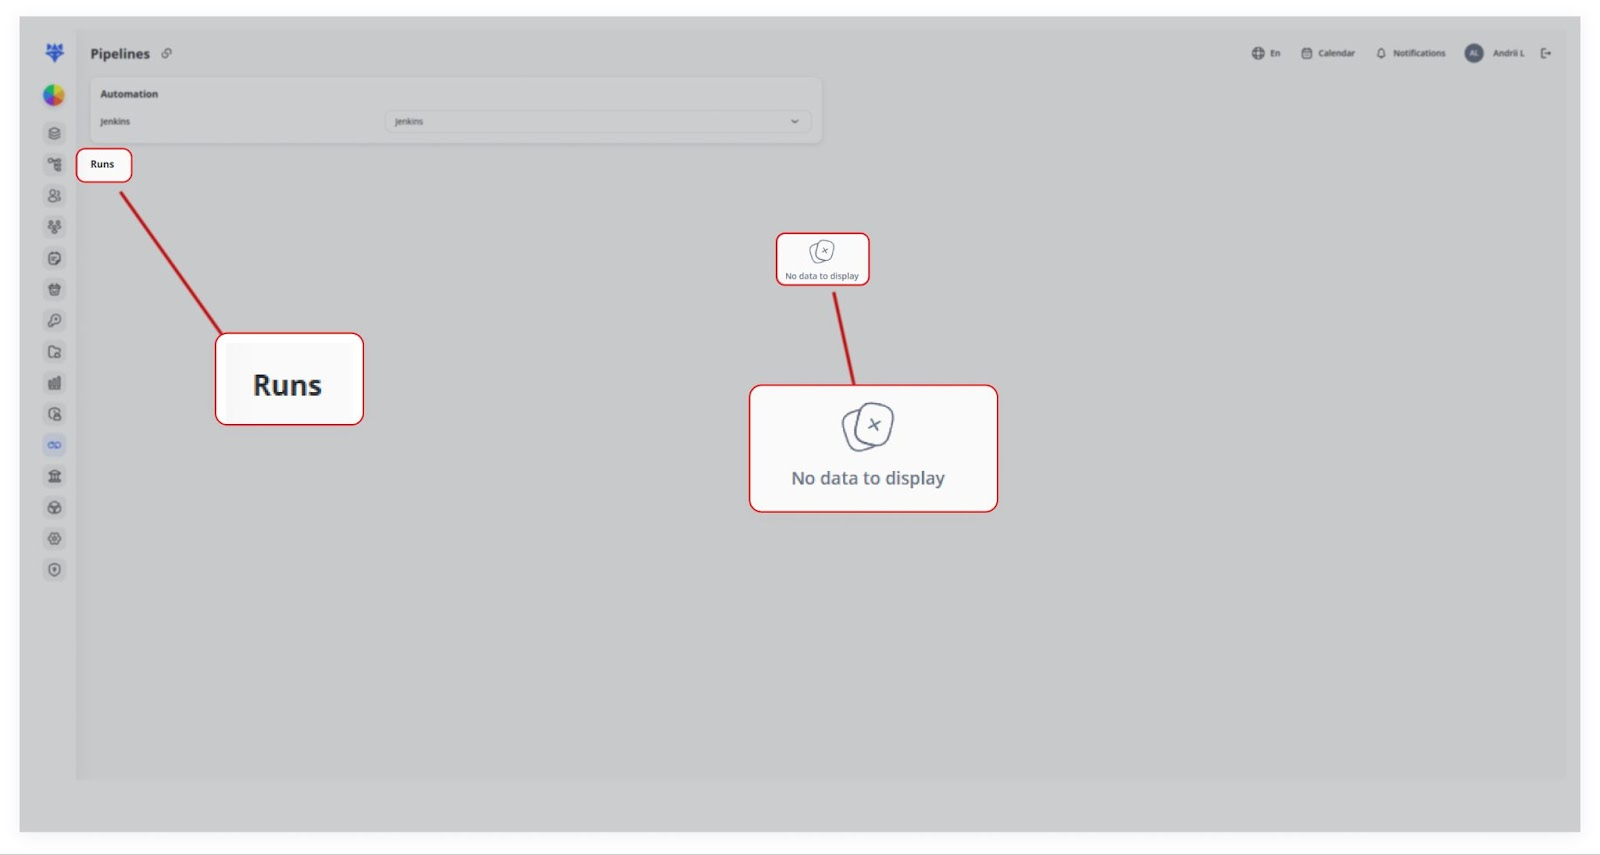
In the provided screenshots, no runs are currently displayed (“No data to display”), but in a real scenario, you’d see a list of pipeline executions, their status, timestamps, and other relevant data.
Getting Started
1. Configure your CI/CD server (e.g. Jenkins) with its API endpoint and access token in Integrations.
2. Select that integration from the Automation dropdown on this page.
3. Trigger a build in Jenkins (or your chosen system).
4. Refresh the Pipelines → Runs table here—your new build appears with full details.
Future Expansions
To integrate additional platforms (GitLab CI, Travis CI, etc.), simply add their API credentials under Integrations. They’ll then appear in the same Automation dropdown for seamless management.