Financial Calculations & Definitions
- Spread
- Static used margin
- Take profit / Stop loss - Distances and Validation
- Trading Account Metrics
- Price Delta
Spread
1. Definition
Spread is the difference between the Ask price (Buy price) and the Bid price (Sell price) of an instrument at a specific moment.
Spread represents the immediate transaction cost paid by the client when opening a position.
2. Formula
Spread = Ask - BidWhere:
-
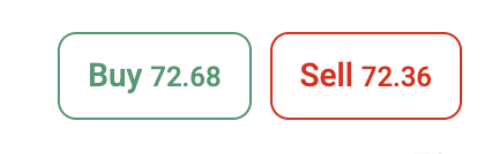
Ask — price displayed in the Buy button
-
Bid — price displayed in the Sell button
3. Example
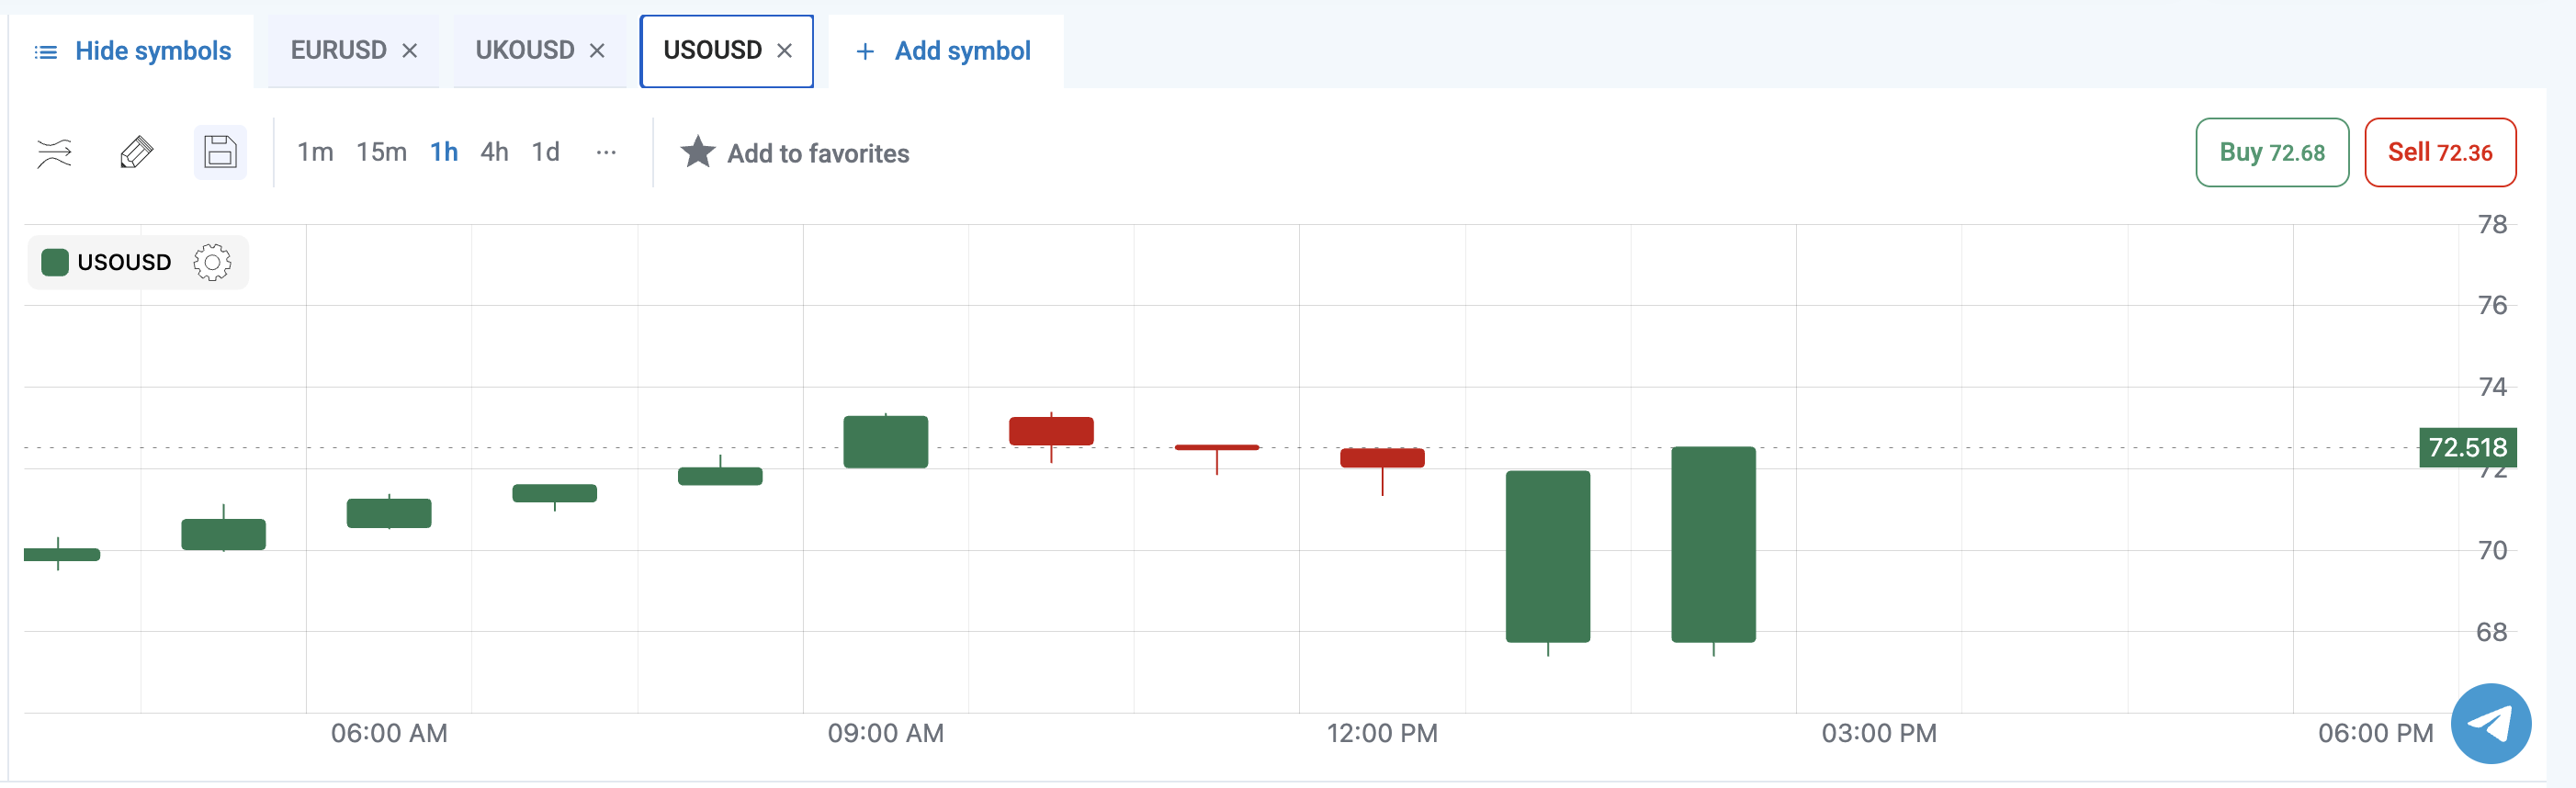
Spread is measured in the instrument price unit.
For instruments quoted against USD (e.g. USOUSD, WTI, BRENT, BTCUSD):
Unit = USDExample:
Ask = 72.68
Bid = 72.36

Spread = 72.68 - 72.36 = 0.32
Result: 0.32 USD
4. Configuration
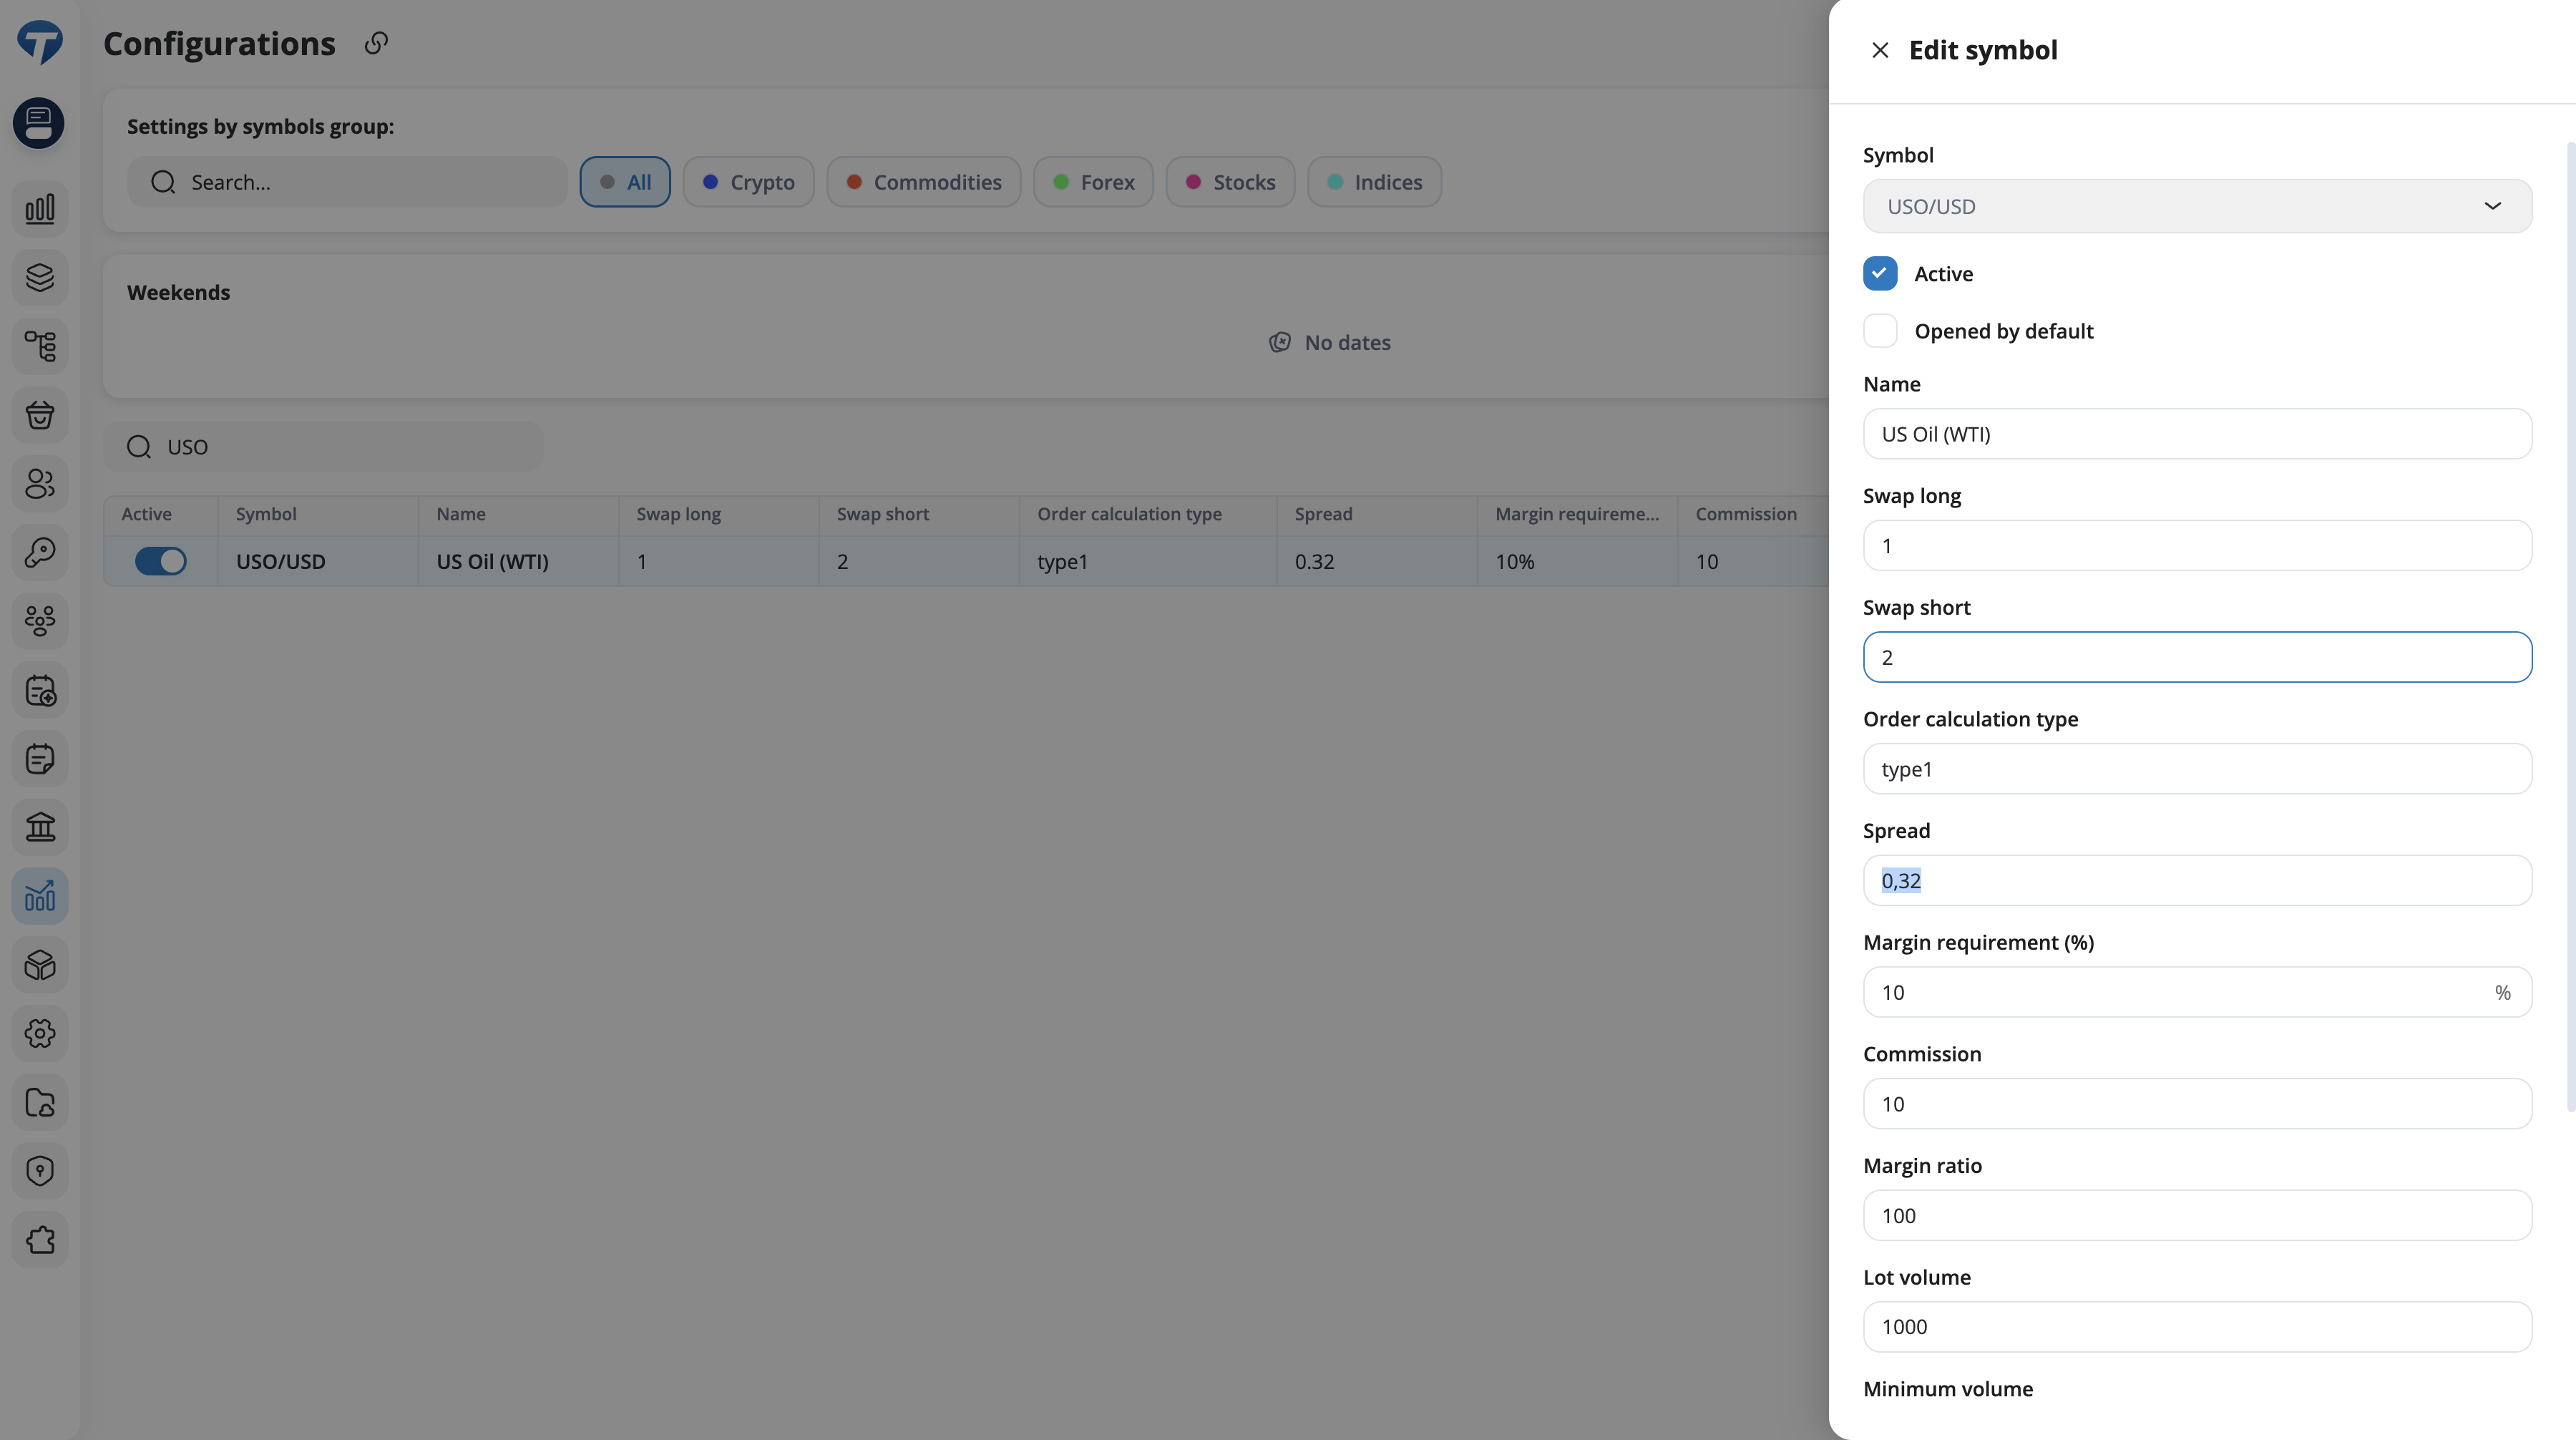
Spread is configurable per symbol in CRM.
Location:
(CRM_URL)/ms/trading/configurationConfiguration is done separately for each symbol.
Field:
Spread
Example (from USO/USD configuration):
-
Spread = 0.32
Static used margin
Overview
Static Used Margin is an optional fixed margin amount that can be applied to a trading position in addition to the standard margin.
This value is stored per order and per position and is included in the account’s total used margin calculation.
If not specified, static used margin defaults to 0.
Business Purpose
Static used margin exists to support cases where standard leverage-based margin alone is insufficient.
| Purpose | Description |
|---|---|
| Regulatory requirements | Some jurisdictions require an additional fixed margin per position regardless of leverage. |
| External risk rules | Liquidity providers or internal risk engines may require an additional fixed margin component. |
| Product-specific margin models | Certain trading products may require a minimum margin per position. |
| Operational risk control | Allows manual or automated systems to increase margin requirements for specific trades. |
Impact on Client Accounts
When static used margin is applied:
-
Used margin increases
-
Free margin decreases
-
Margin level decreases
-
Margin call / liquidation may trigger earlier
This provides additional risk protection for the platform.
Margin Calculation
Position Used Margin Formula
Used Margin = Leverage Margin + Static Used MarginWhere:
Leverage Margin
Leverage Margin = Position Value ÷ LeverageExample:
| Parameter | Value |
|---|---|
| Position Value | €10,000 |
| Leverage | 1:10 |
| Leverage Margin | €1,000 |
| Static Used Margin | €200 |
Result:
Used Margin = 1000 + 200 = €1,200Defaults
| Field | Default |
|---|---|
| static_used_margin | 0 |
If not set:
Used Margin = Leverage Margin
Example Scenario
A broker introduces minimum margin per trade = €500.
Trade parameters:
| Parameter | Value |
|---|---|
| Position Value | €4,000 |
| Leverage | 1:20 |
Leverage Margin:
4000 / 20 = €200Minimum margin required = €500
Static margin applied:
static_used_margin = 300Final used margin:
200 + 300 = €500Summary
| Attribute | Description |
|---|---|
| Type | Fixed additional margin |
| Level | Per position |
| Default | 0 |
| Purpose | Regulatory / risk / product margin rules |
| Effect | Increases used margin and reduces free margin |
Take profit / Stop loss - Distances and Validation
Overview
Take Profit (TP) and Stop Loss (SL) can be set when:
-
opening a new order
-
modifying an existing order
When TP or SL is enabled, the platform:
-
Automatically fills default values
-
Validates minimum distance from the reference price
-
Clears the value if the option is disabled
The rules depend on the symbol group.
| Symbol group | Distance type |
|---|---|
| Crypto | Percentage |
| Other instruments (Forex, indices, commodities, etc.) | Pips / points |
Symbol Groups
The system determines the rule set based on the symbol group.
| Group | Behavior |
|---|---|
| Crypto | Percentage-based TP/SL |
| Other groups | Pip / point-based TP/SL |
Default TP / SL Values
When a user enables Take Profit or Stop Loss, the system automatically inserts a default value.
| Asset class | Side | Default Take Profit | Default Stop Loss |
|---|---|---|---|
| Crypto | BUY | Ask + 1% | Ask − 1% |
| Crypto | SELL | Bid − 1% | Bid + 1% |
| Other instruments | BUY | Ask + 100 pips | Ask − 100 pips |
| Other instruments | SELL | Bid − 100 pips | Bid + 100 pips |
Important
-
Defaults are intentionally larger than the minimum allowed distance.
-
This ensures automatically generated TP/SL values are always valid.
Minimum Distance
TP and SL must be placed at least a minimum distance away from the reference price.
| Asset class | Minimum distance |
|---|---|
| Crypto | 0.1% of reference price |
| Other instruments | 1 pip |
The system prevents users from placing TP or SL inside this restricted zone.
Validation Rules
BUY Orders
| Rule |
|---|
| Take Profit must be above the reference price |
| Stop Loss must be below the reference price |
Additionally:
-
TP must be at least minimum distance above
-
SL must be at least minimum distance below
SELL Orders
| Rule |
|---|
| Take Profit must be below the reference price |
| Stop Loss must be above the reference price |
Additionally:
-
TP must be at least minimum distance below
-
SL must be at least minimum distance above
Reference Price
The reference price used for TP/SL calculation depends on context.
| Context | Order type | Reference price |
|---|---|---|
| New order | MARKET | Current Ask for BUY, Bid for SELL |
| New order | LIMIT | Limit price entered in the form |
| Modify order | MARKET | Order execution price |
| Modify order | LIMIT | Updated limit price (if edited), otherwise existing order price |
Example Calculations
Crypto Example
Reference price:
BTC = 50,000| Value | Result |
|---|---|
| Default TP | 50,500 |
| Default SL | 49,500 |
| Minimum distance | 50 |
EUR/USD Example
Reference price:
Ask = 1.0850| Value | Result |
|---|---|
| Default TP | 1.0950 |
| Default SL | 1.0750 |
| Minimum distance | 0.0001 |
USD/JPY Example
Reference price:
Ask = 150.25| Value | Result |
|---|---|
| Default TP | 151.25 |
| Default SL | 149.25 |
| Minimum distance | 0.01 |
Where These Rules Apply
Order Form (New Orders)
When creating a new order:
-
Default TP/SL values are inserted when enabled
-
Validation ensures minimum distance rules are respected
-
TP/SL values are cleared when disabled
Modify Order
When editing an existing order:
-
Default TP/SL values follow the same rules
-
Reference price is based on the order price
-
Validation rules remain identical
Key Principles
The system follows three main principles:
-
Automatic defaults
When TP/SL is enabled, reasonable default levels are provided. -
Minimum distance protection
TP/SL cannot be placed too close to the reference price. -
Consistency across workflows
The same rules apply when creating and modifying orders.
Summary
| Feature | Crypto | Other Instruments |
|---|---|---|
| Default TP | ±1% | ±100 pips |
| Default SL | ∓1% | ∓100 pips |
| Minimum distance | 0.1% | 1 pip |
| Reference price | Ask / Bid | Ask / Bid |
Defaults are intentionally larger than the minimum allowed distance, ensuring automatically generated TP/SL values always pass validation.
Trading Account Metrics
This section describes the financial and margin properties displayed in the trading account panel. These metrics represent the current state of a trader’s account, including capital, open position performance, and margin usage.
Displayed properties:
Balance
On Hold (displayed if exists)
Equity
Profit
Used Margin (displayed if exists)
Free Margin
Margin Level (displayed if Used Margin exists)
Leverage
1. Balance
Description
Balance represents the total funds in the trading account after all closed operations.
Balance reflects realized results only and does not include floating profit or loss from open positions.
Opening a position does not change Balance.
Balance Changes When
-
deposit is completed
-
withdrawal is completed
-
trade is closed
-
swap is charged
-
commission is charged
-
manual adjustment is made
Formula
Balance =
Deposits
+ Closed Profits
- Closed Losses
- Completed Withdrawals
- Commissions
- Swaps
+ Adjustments
Simplified:
Balance = Previous Balance + Realized PnL2. On Hold
Description
On Hold represents funds temporarily reserved for pending financial operations, such as withdrawal requests.
These funds are excluded from the amount available for trading until the operation is completed or cancelled.
Display Rule
Displayed only if On Hold > 0Example
Balance = 10 000
On Hold = 3 000
Funds available for trading:
Available Balance = 7 0003. Equity
Description
Equity represents the current real-time value of the account, including floating profit or loss from open positions.
Equity changes continuously as market prices move.
It is the primary value used for margin risk calculations.
Formula
Equity = (Balance − On Hold) + ProfitWhere:
Profit = Floating PnL from open positions4. Profit
Description
Profit represents the unrealized profit or loss from open positions.
It updates continuously based on market price changes.
Positive values represent profit, negative values represent loss.
5. Used Margin
Description
Used Margin represents the total collateral required to maintain all open positions.
Margin is not a cost and does not reduce the account balance. It represents funds temporarily reserved by the trading engine to support open positions.
Display Rule
Displayed only if Used Margin > 0Total Used Margin
Used Margin = sum(margin of all open positions)6. Free Margin
Description
Free Margin represents the amount of funds available to open new positions.
Free Margin decreases when:
-
new positions are opened
Formula
Free Margin = Equity − Used Margin7. Margin Level
Description
Margin Level represents the ratio between equity and used margin, expressed as a percentage.
It is the primary indicator of account risk and determines when margin call or stop-out conditions occur.
Display Rule
Displayed only if Used Margin > 0Formula
Margin Level (%) = (Equity / Used Margin) × 1008. Leverage
Description
Leverage defines the maximum trading exposure relative to the trader’s capital.
Higher leverage reduces the margin required to open positions.
Example
Leverage = 1:100Meaning the trader can control:
100 units of market exposure for every 1 unit of capitalAccount Calculation Relationships
The core account metrics are calculated using the following relationships:
Profit = Floating PnL

Equity = (Balance − On Hold) + Profit

Used Margin = sum(position margins)

Free Margin = Equity − Used Margin

Margin Level (%) = (Equity / Used Margin) × 100
Price Delta
Overview
Price Delta is a mechanism to simulate controlled price movement for a symbol over a defined time interval.
The system:
-
Applies a fixed price shift (in pips) during a selected period
-
Smoothly transitions into and out of this shift
-
Prevents unrealistic instant price jumps
This feature is primarily used for:
-
testing trading scenarios
-
simulating volatility
-
validating risk, margin, and liquidation logic
Core Concepts
1. Time Range (From / To)
Defines the main active interval where the full price change is applied.
-
From — start time of full delta
-
To — end time of full delta
During this interval:
Price is shifted by the full configured delta
2. Price Delta (Pips)
Defines the magnitude of the price change.
-
Positive → price increases
-
Negative → price decreases
Formula:
Adjusted Price = Base Price ± Delta3. Smooth Change Steps
Defines how many incremental steps are used to gradually apply and remove the delta.
-
Steps are applied:
-
before the main interval
-
after the main interval
-
-
Prevents sharp jumps in the chart
4. Step Duration
Defines how long each smoothing step lasts.
-
Unit: minutes
-
Total smoothing duration =
steps × step_duration
Full Behavior Model
The system consists of 3 phases:
1. Pre-Smoothing Phase
-
Starts before
From -
Price gradually moves from:
0 → full delta
2. Active Phase
-
Between
FromandTo -
Price remains at:
full delta
3. Post-Smoothing Phase
-
Starts after
To -
Price gradually returns:
full delta → 0
Example — Correct Timeline
Configuration
| Parameter | Value |
|---|---|
| Symbol | EUR/USD |
| From | 10:00 |
| To | 11:00 |
| Delta | +100 pips |
| Smooth Steps | 10 |
| Step Duration | 10 minutes |
Calculations
-
Smoothing duration:
10 × 10 min = 100 minutes
Timeline
08:20 → smoothing starts
10:00 → full +100 pips reached
10:00–11:00 → constant +100 pips
11:00 → smoothing down starts
12:40 → price returns to normal
Step Behavior
Pre-smoothing
08:20 → +10 pips
08:30 → +20 pips
...
09:50 → +100 pips
10:00 → full delta active
Active Phase
10:00 → 11:00Price = +100 pips
Post-smoothing
11:00 → +90 pips
11:10 → +80 pips
...
12:40 → 0 pips
Visual Model
Price
  |
  |          ─────────────── (+100 pips)
  |        /                \
  |      /                    \
  |_____/                      \______
      ↑                        ↑
   smoothing              smoothing
     start                  end
Important Rules
1. Delta is Absolute
-
Applied relative to current/base price
-
Not cumulative over time
2. Smoothing Applies on Both Sides
-
Nsteps beforeFrom -
Nsteps afterTo
3. No Instant Application
The system does NOT support:
-
immediate price override
-
single candle injection
All changes must follow:
defined timeline + smoothing
4. Time Validity
-
Time must be within:
00:00 – 23:59 -
If smoothing goes before
00:00:
→ it moves to the previous day
Edge Cases
1. Smoothing in the Past
If:
-
smoothing start time is already in the past
Then:
-
steps may be skipped or not applied correctly
2. Zero Steps
If:
Smooth Steps = 0Then:
-
instant jump at
From -
instant revert at
To
3. Negative Delta
Works identically:
Delta = -50 pipsResult:
-
price decreases smoothly
-
holds lower level
-
returns gradually