10. How to Work With Affiliate Hub Dashboard
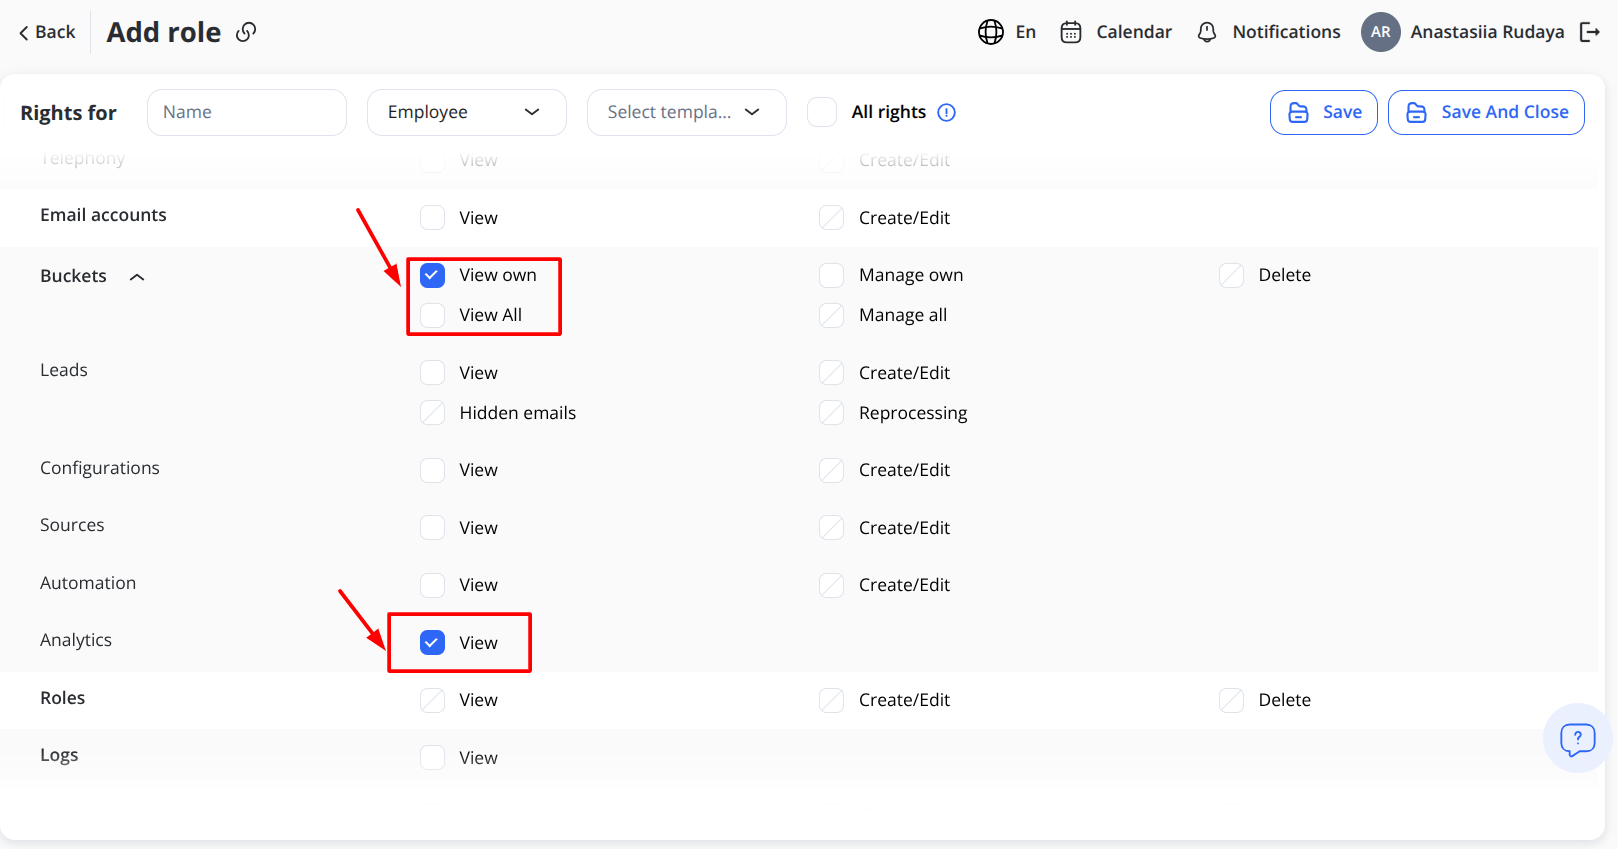
Employees and Affiliates can access analytics only when the relevant permission is enabled in their Role. To grant access, first define whether the user can view all Affiliate Hubs or only their own Affiliate Hub, then enable the View checkbox in the Analytics block. The analytics data displayed in the system will vary depending on the selected access level.
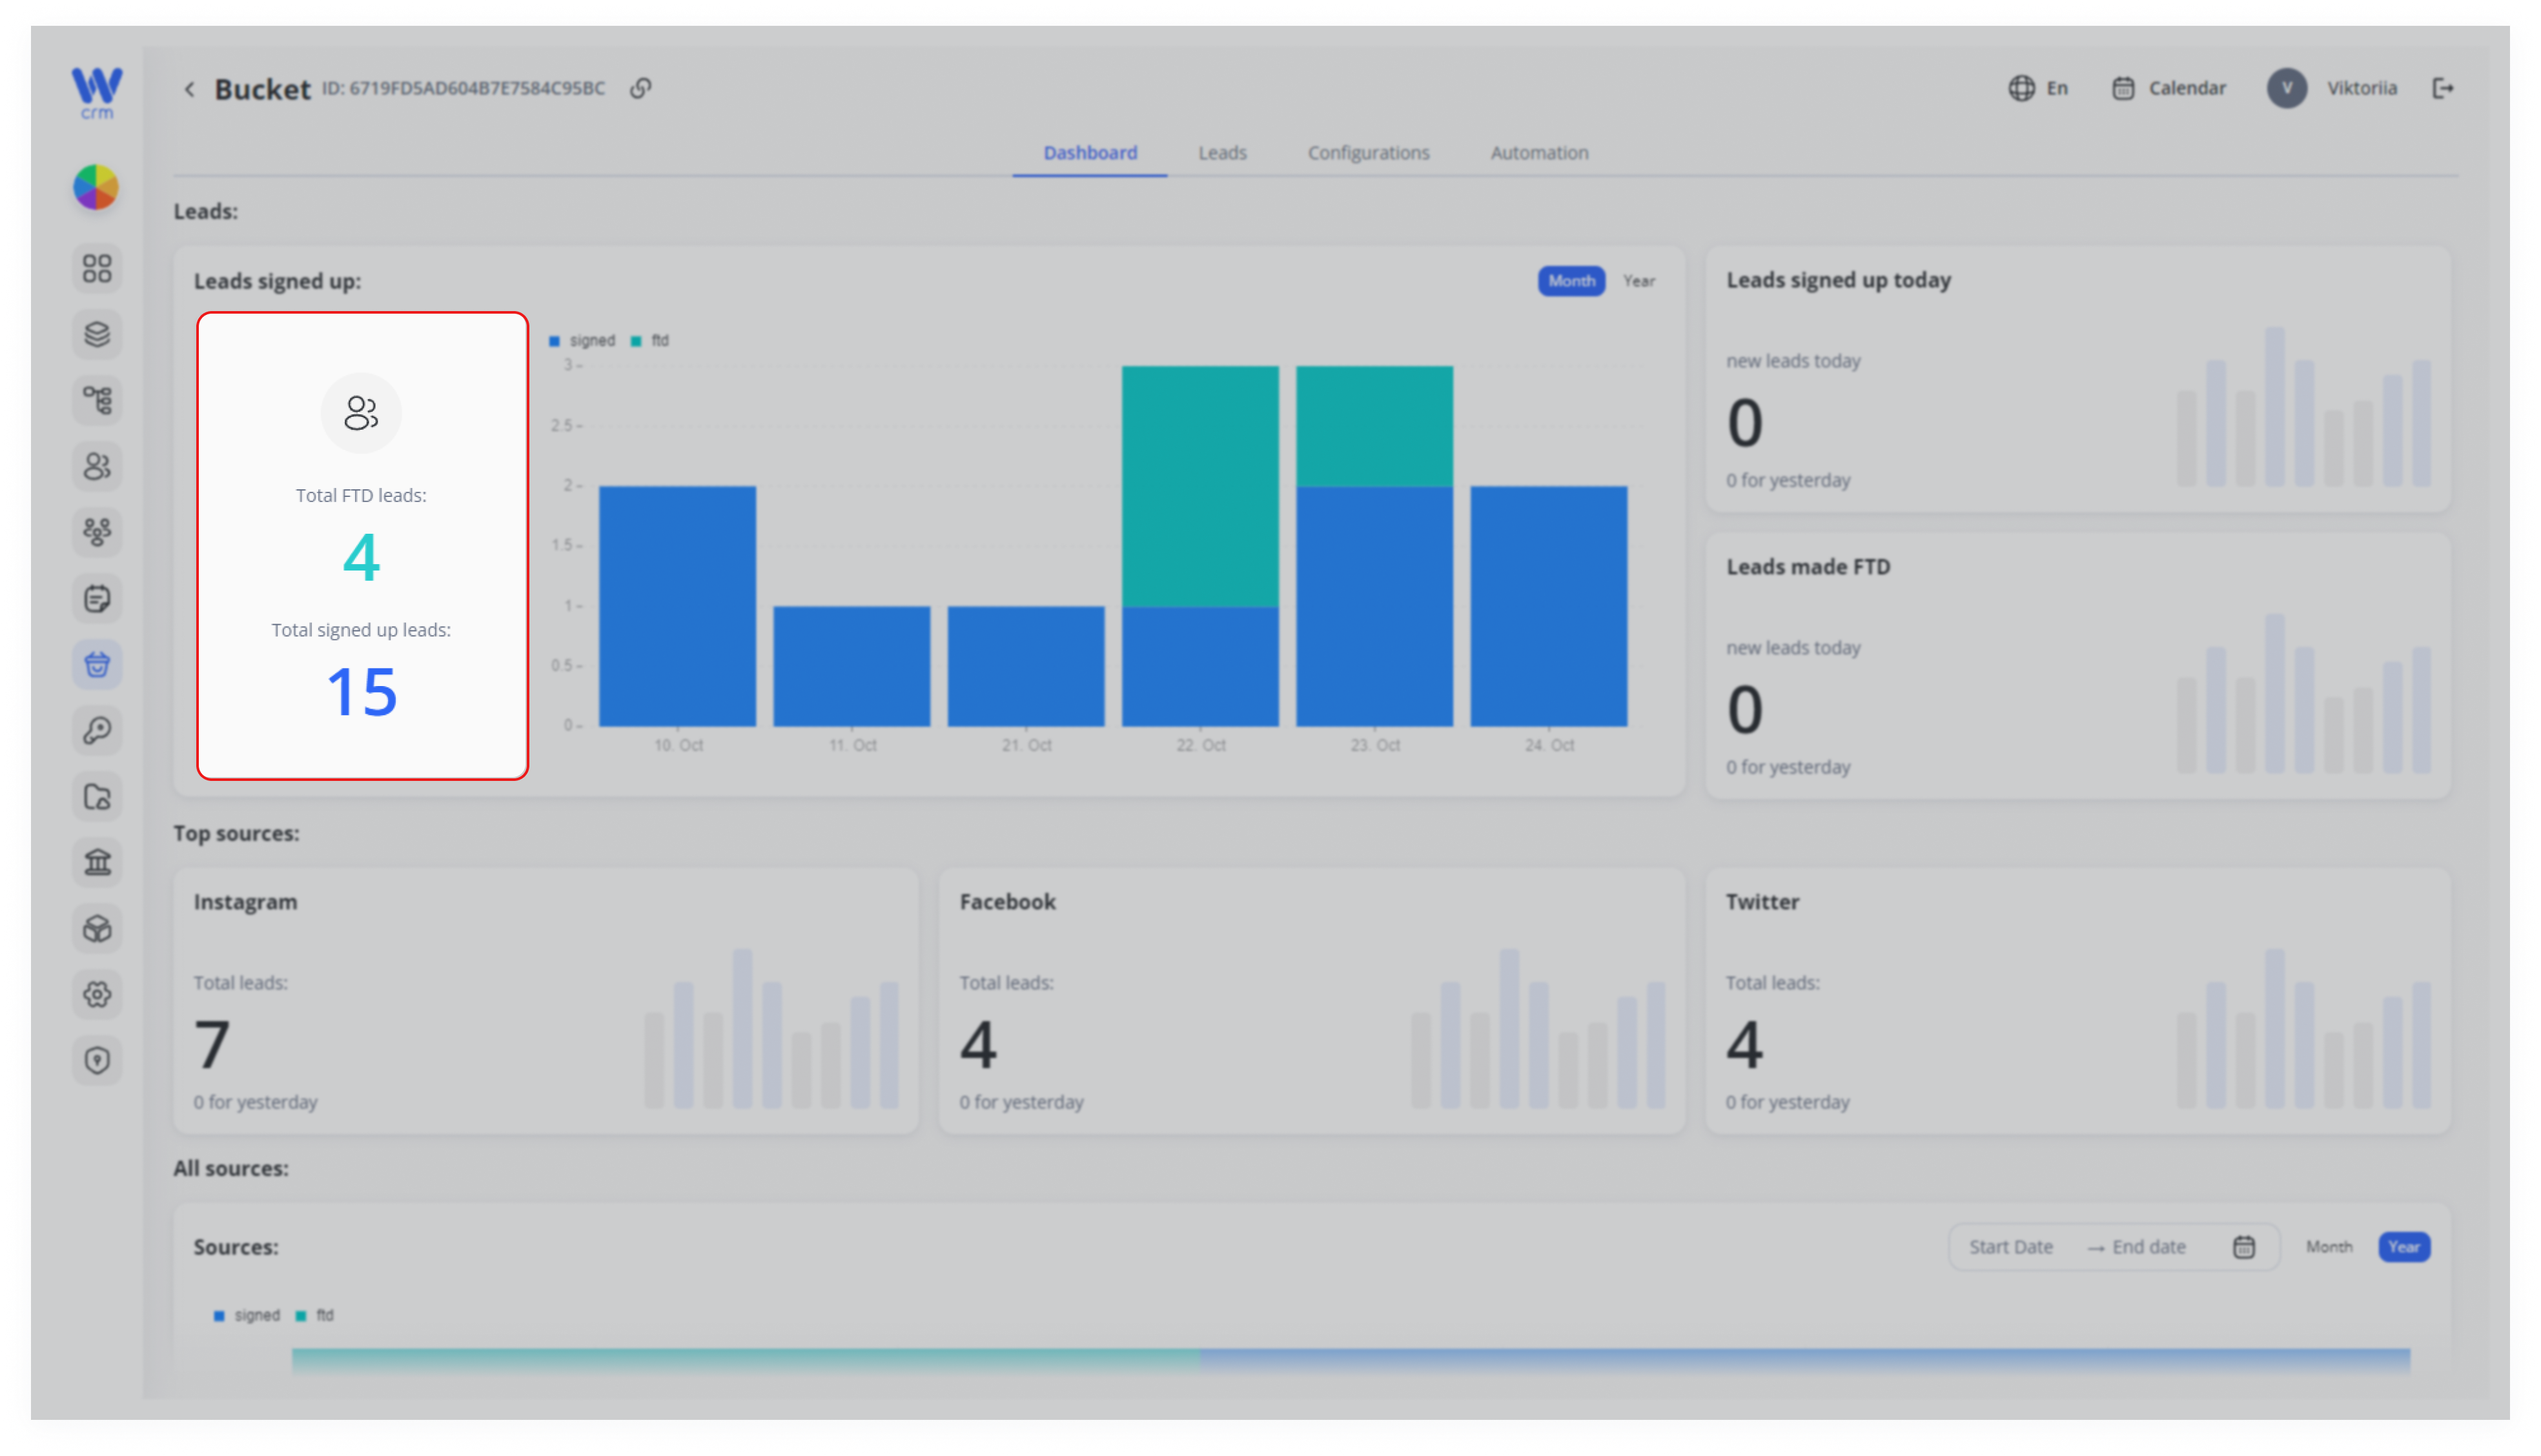
The dashboard primarily displays the number of leads who have signed up. In this section, you’ll see the total FDV leads and the total signed-up leads.
This information is also presented on the chart on the right. In the upper-right corner, you can select Month or Year to adjust the lead distribution view on the graph.
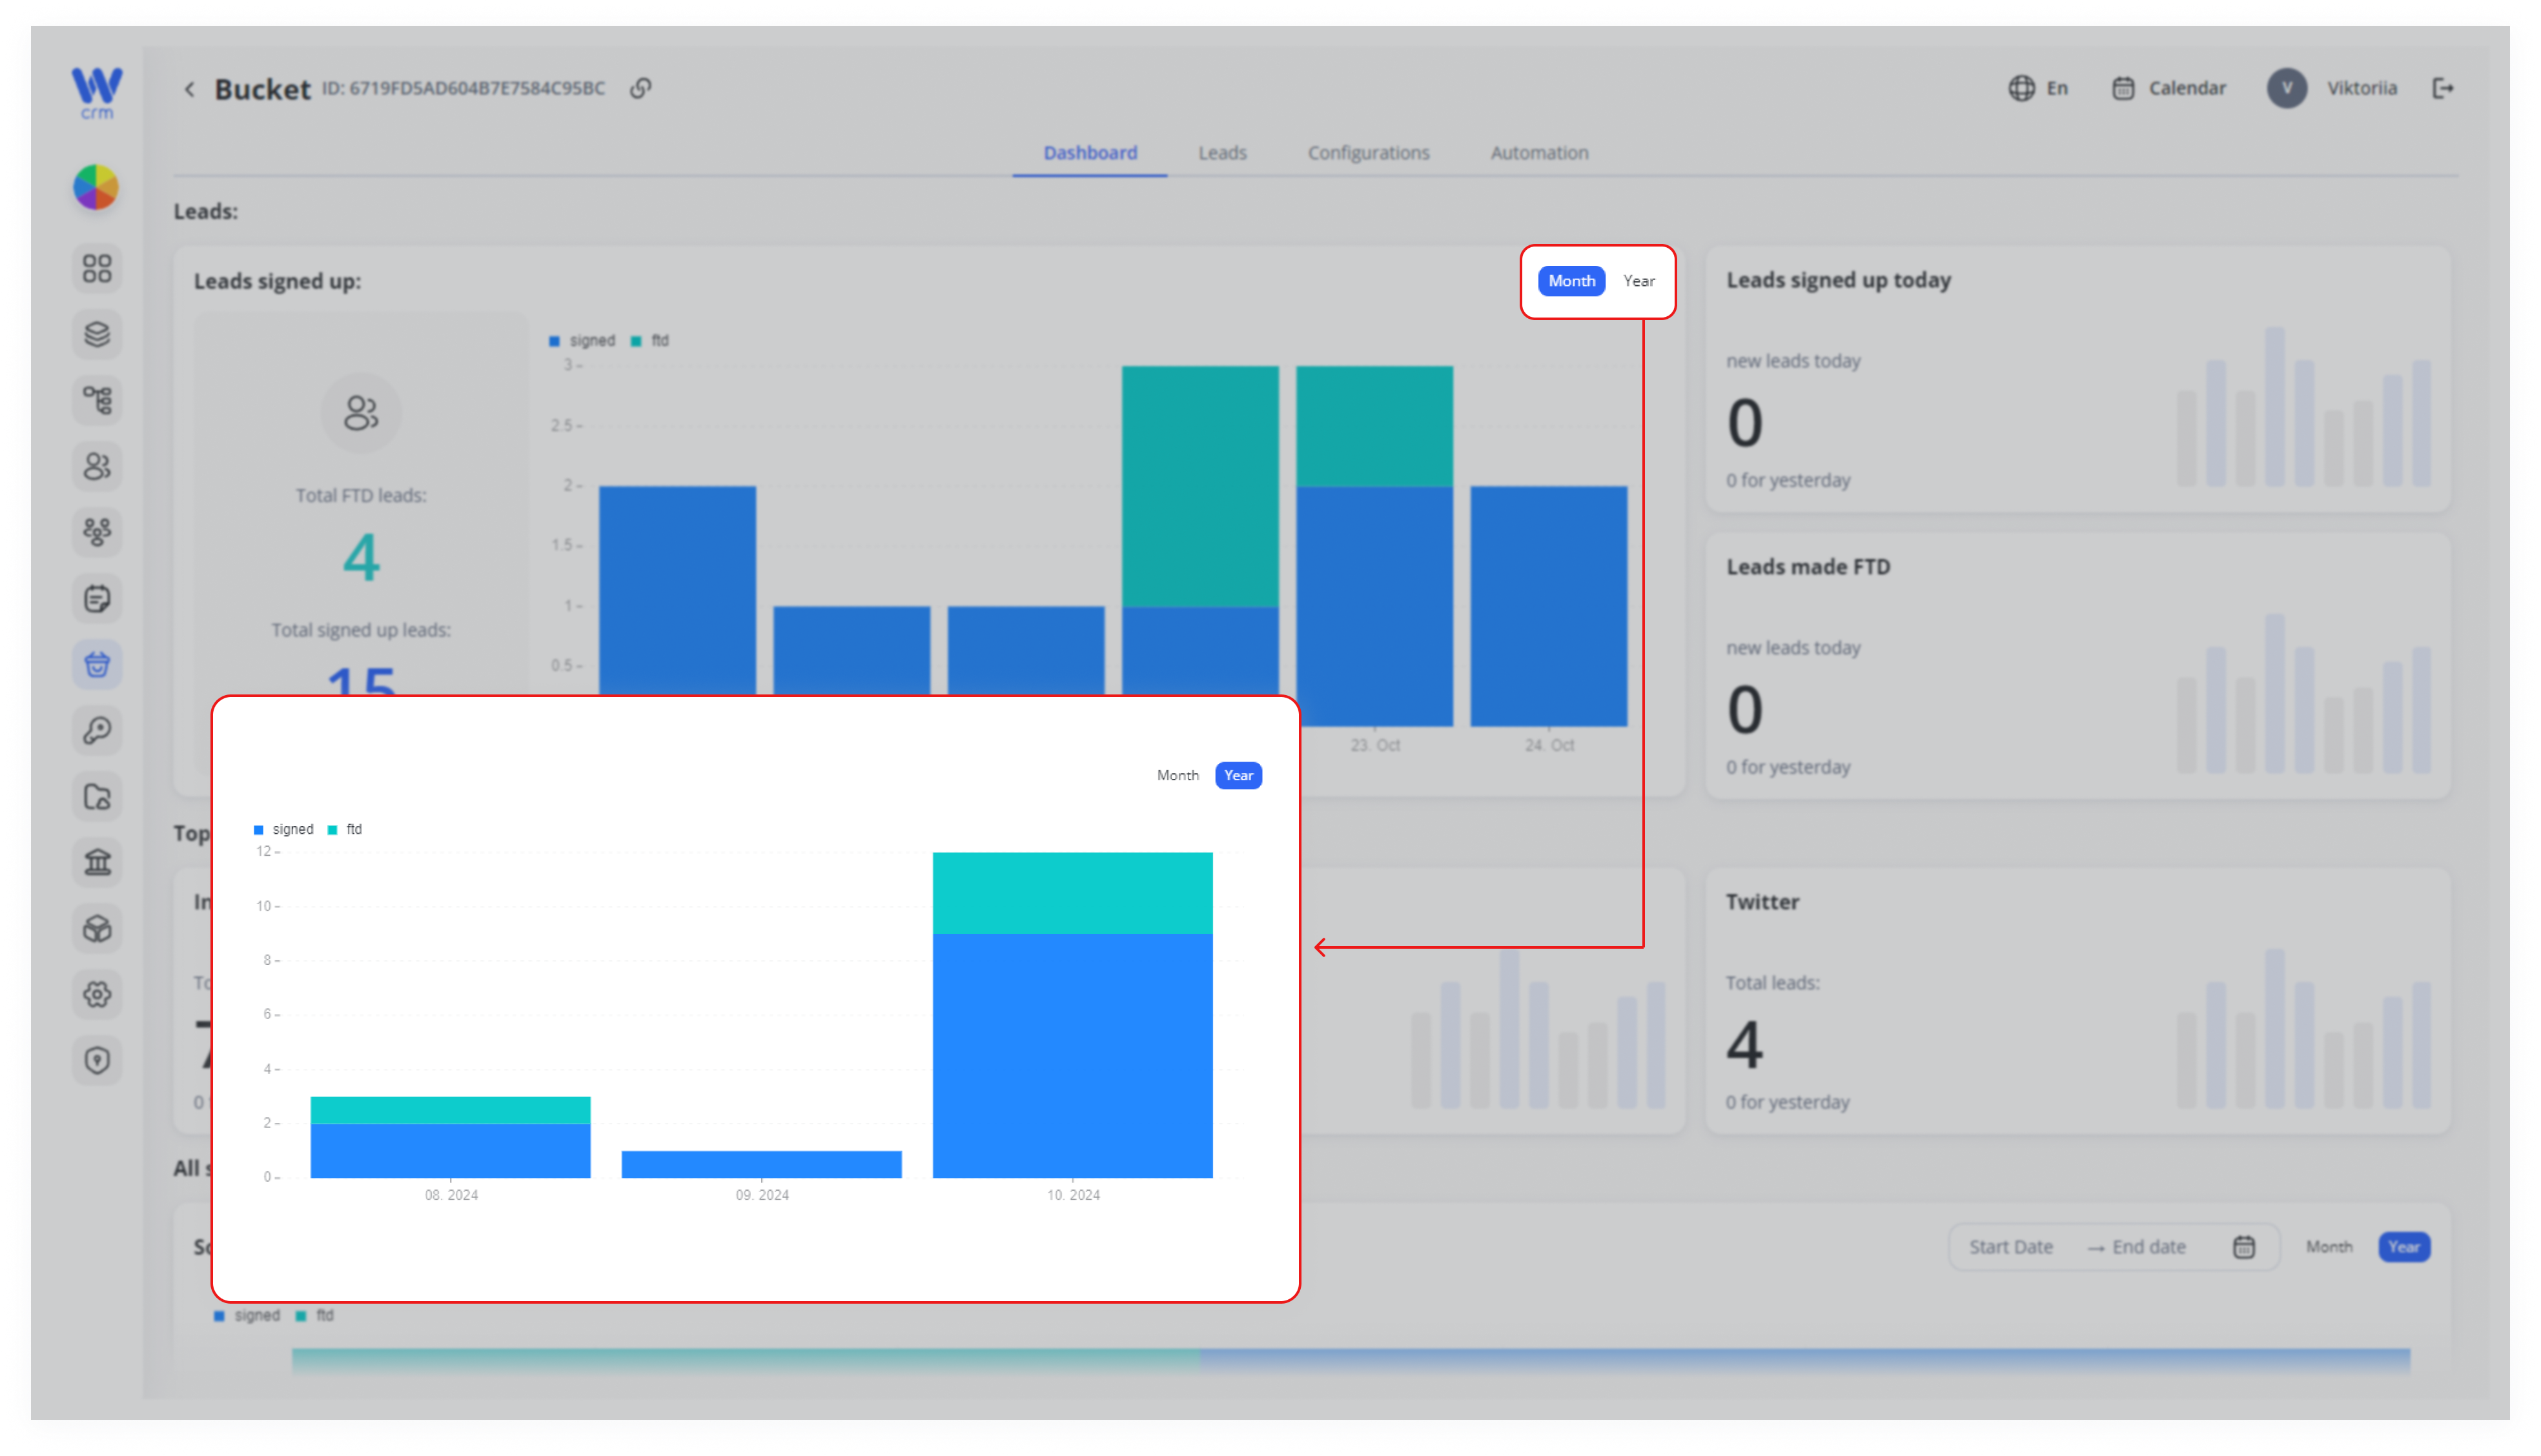
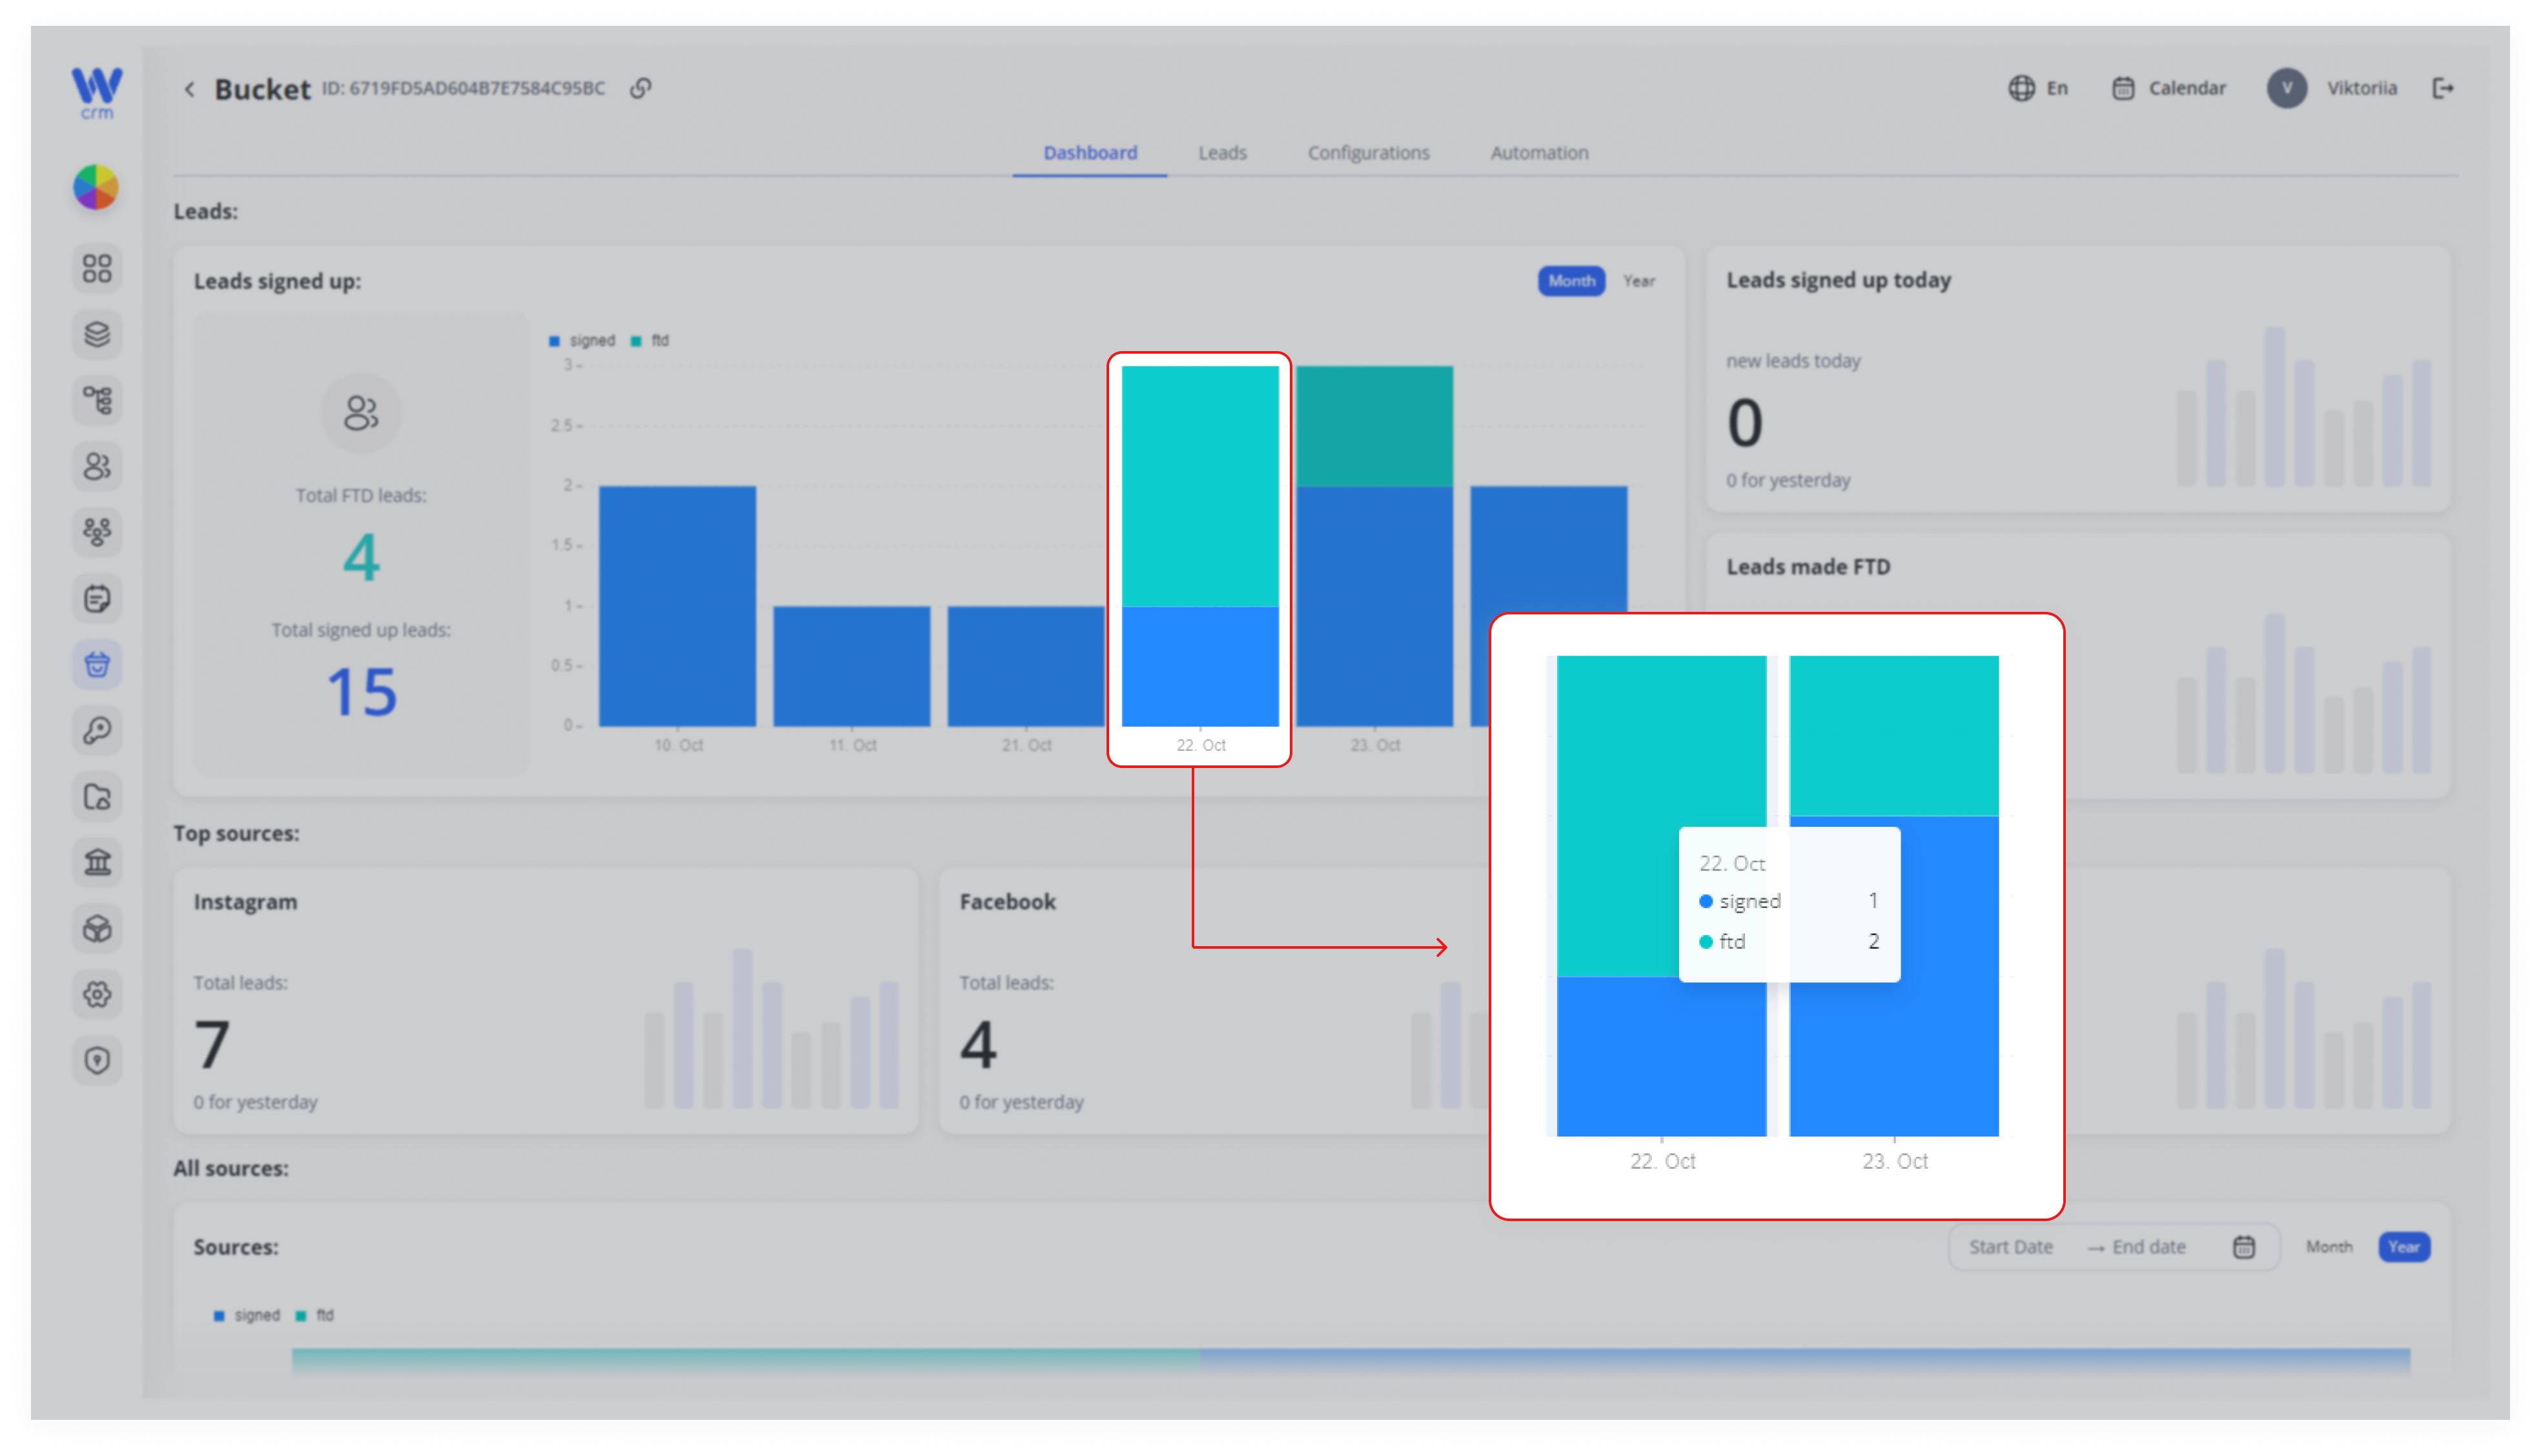
If you hover your mouse over a specific column, you can view how many leads came in for the selected month/year.
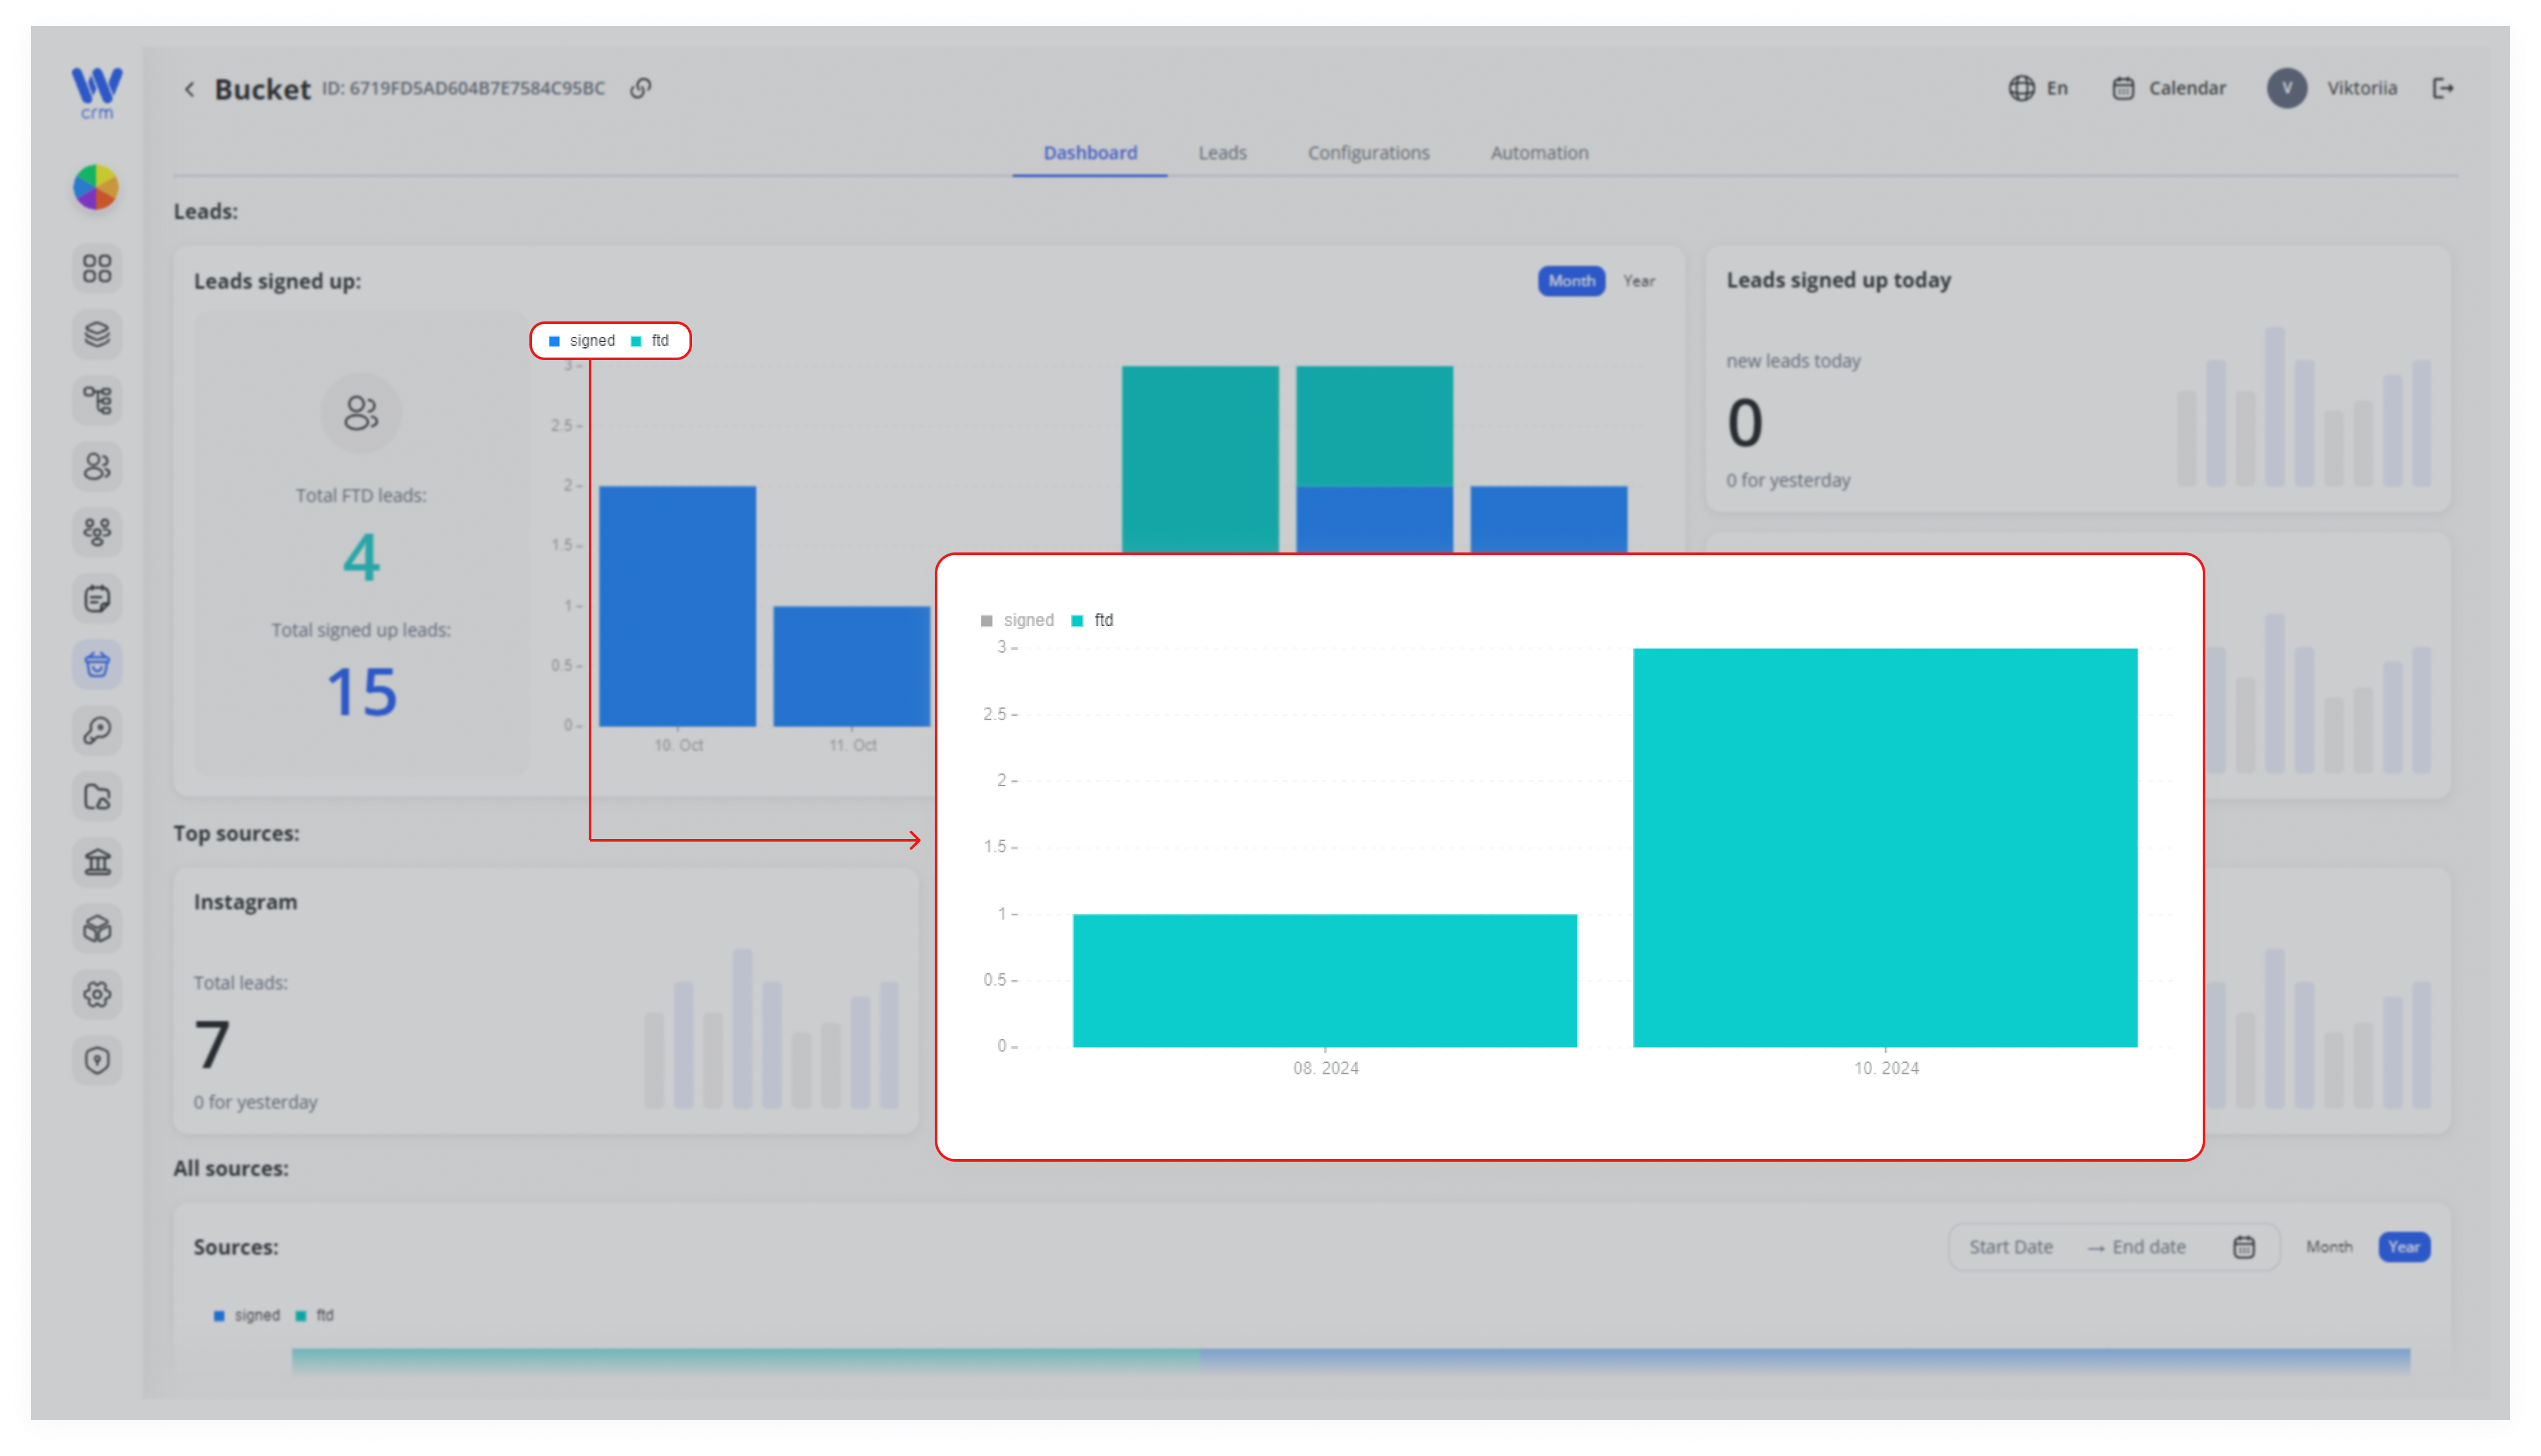
You can also display only FTD or only signed up leads.
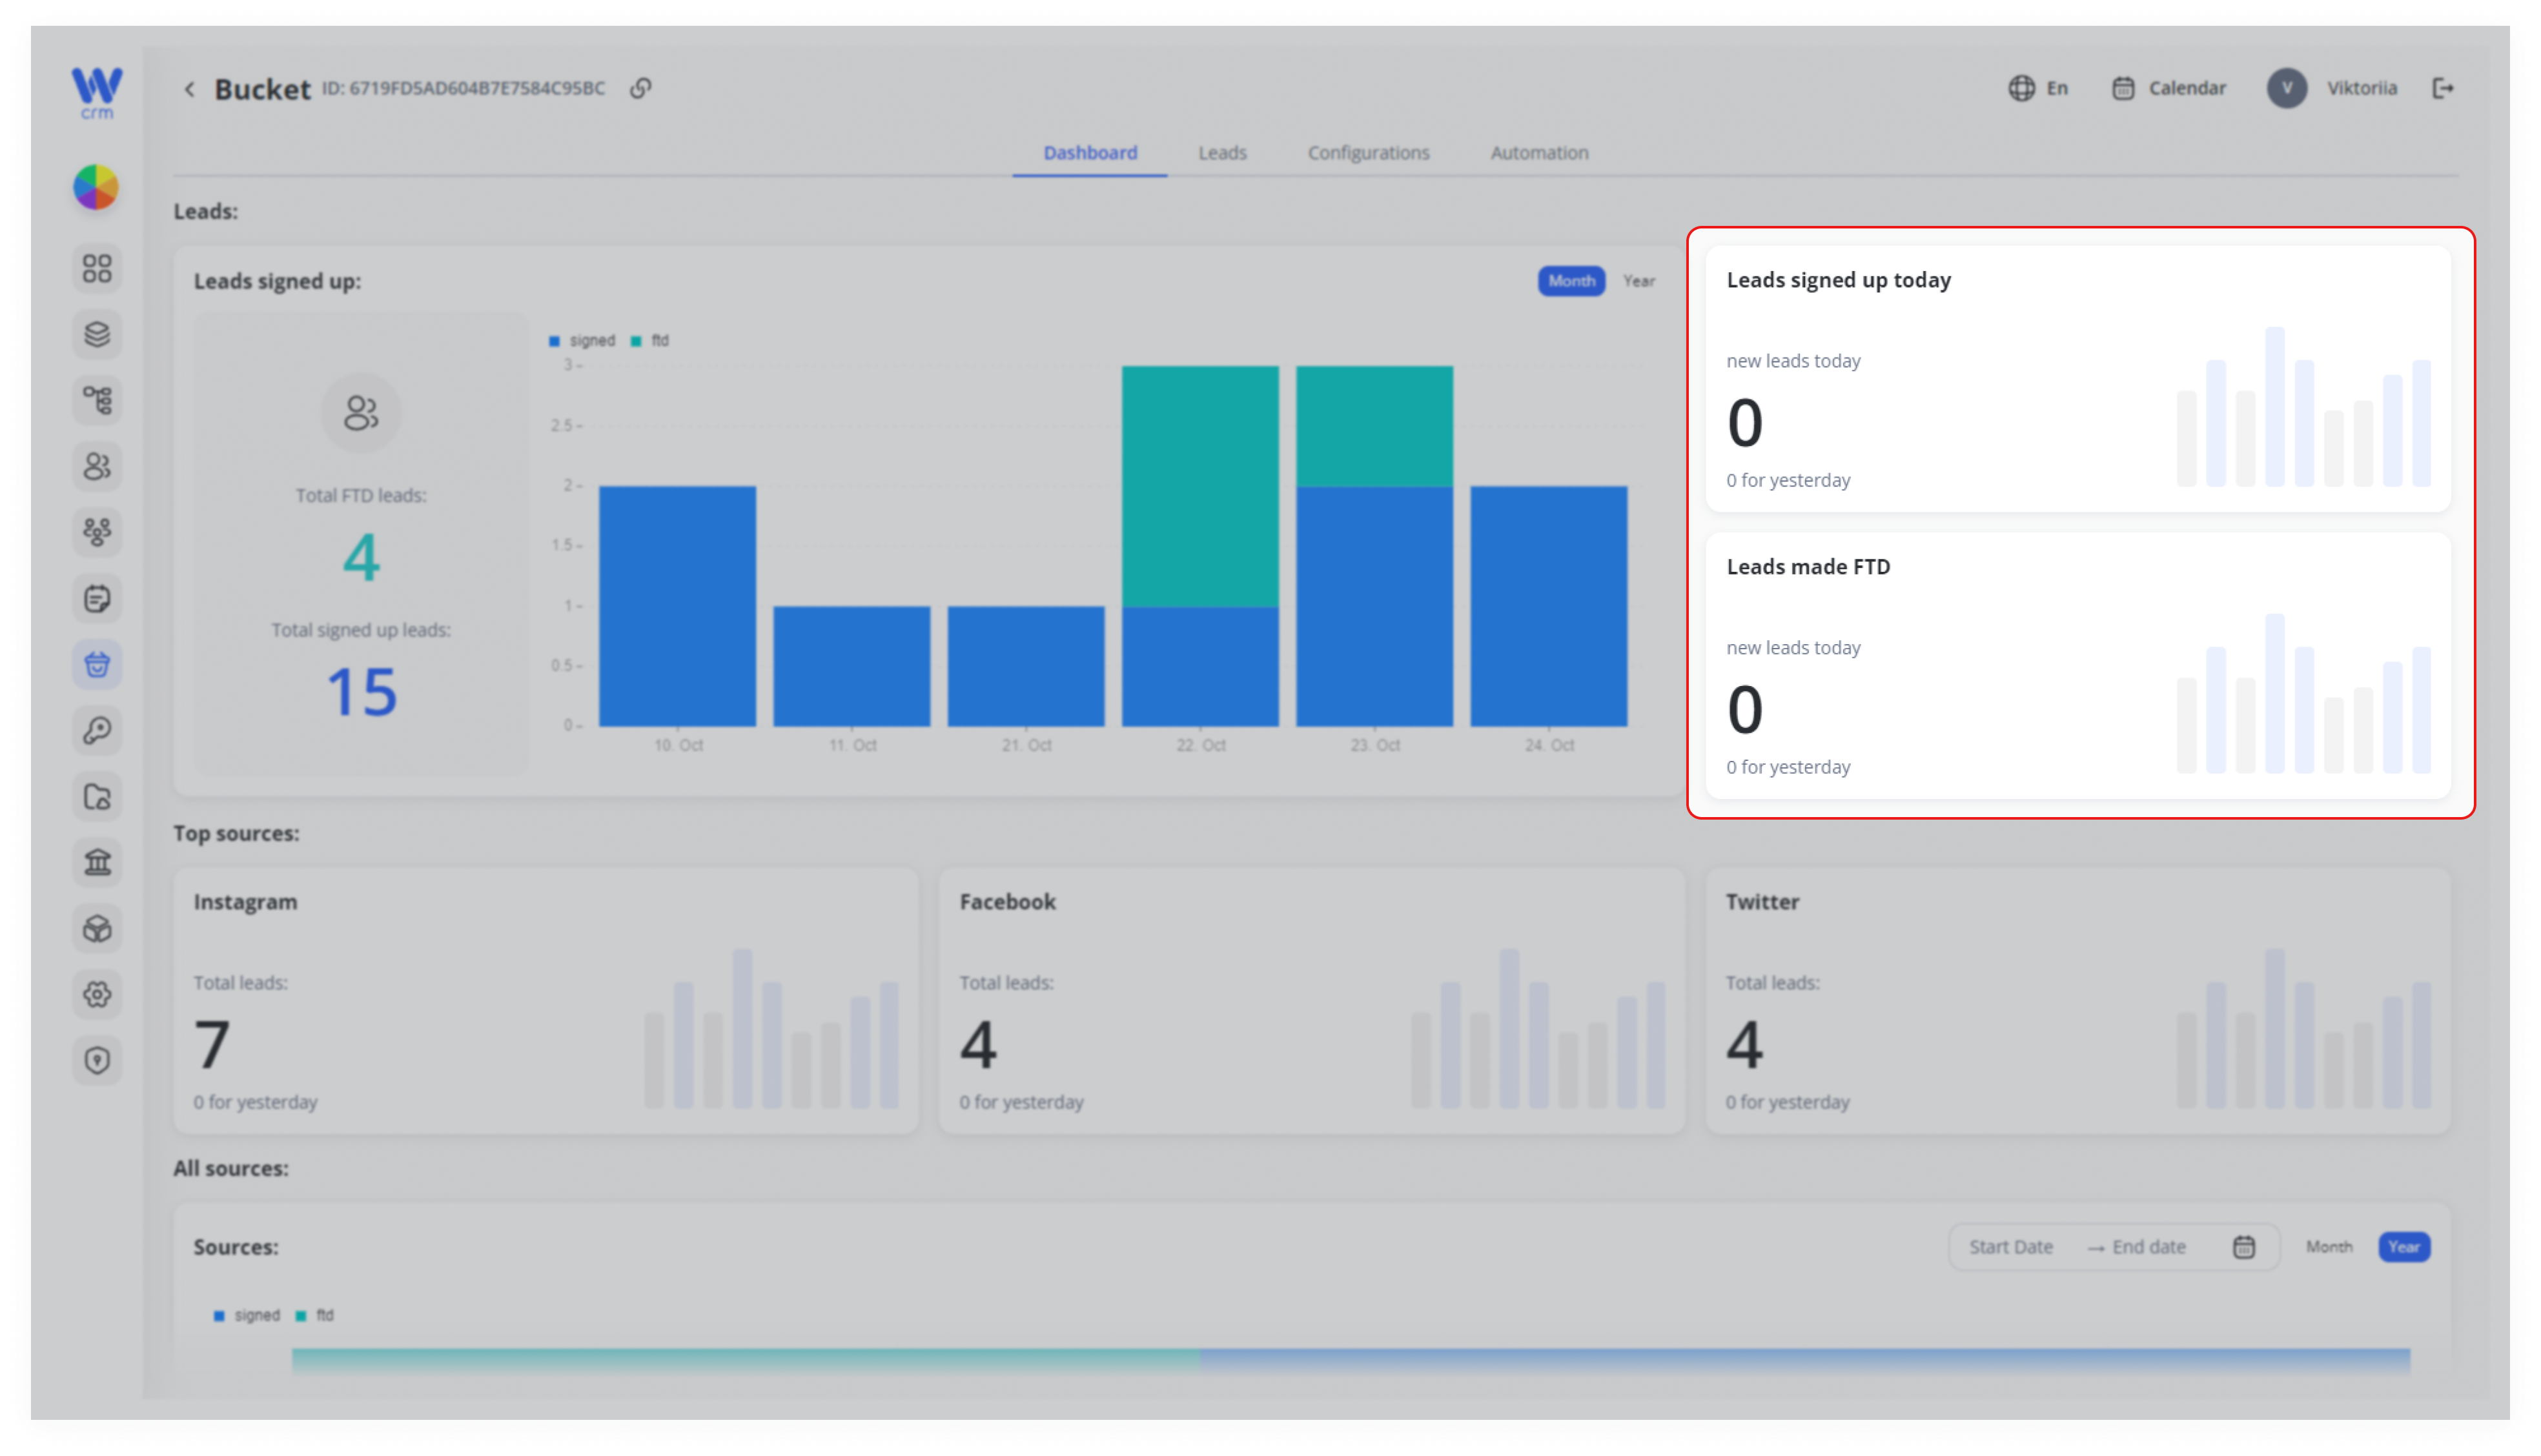
The section on the right displays the number of FTD and signed-up leads for today and yesterday.
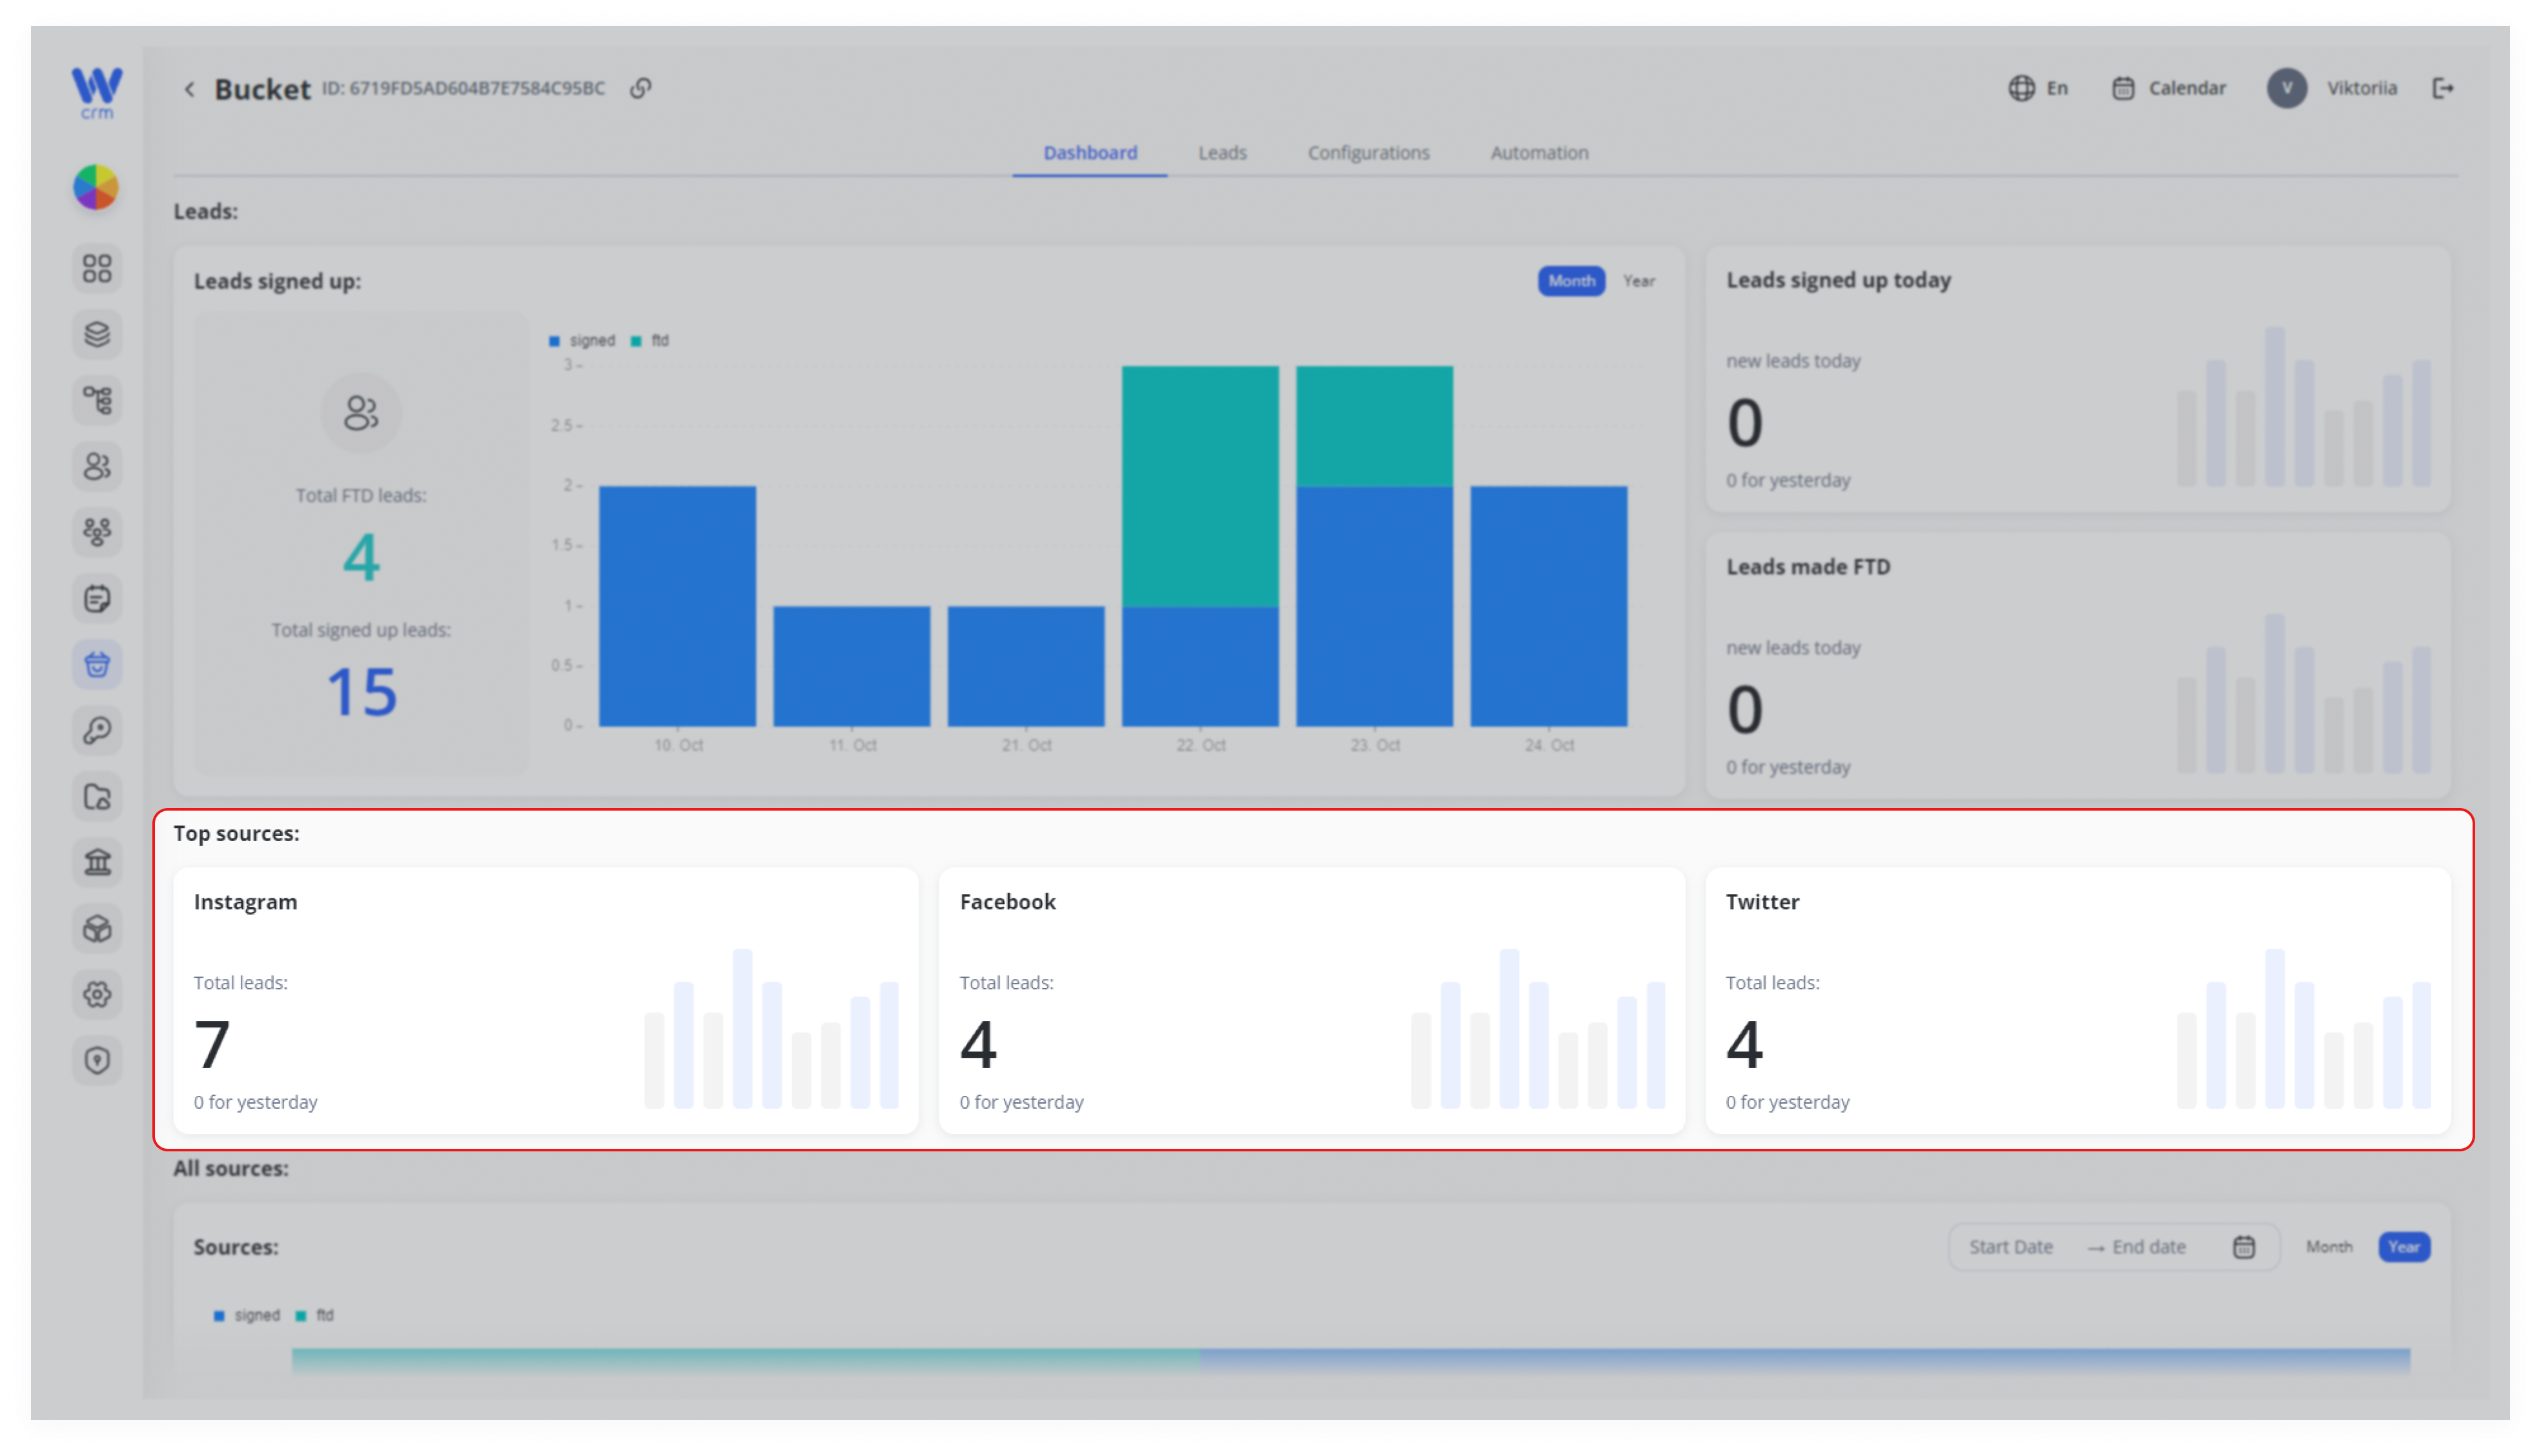
And in the blocks below, you can see the top sources where your leads are coming from.
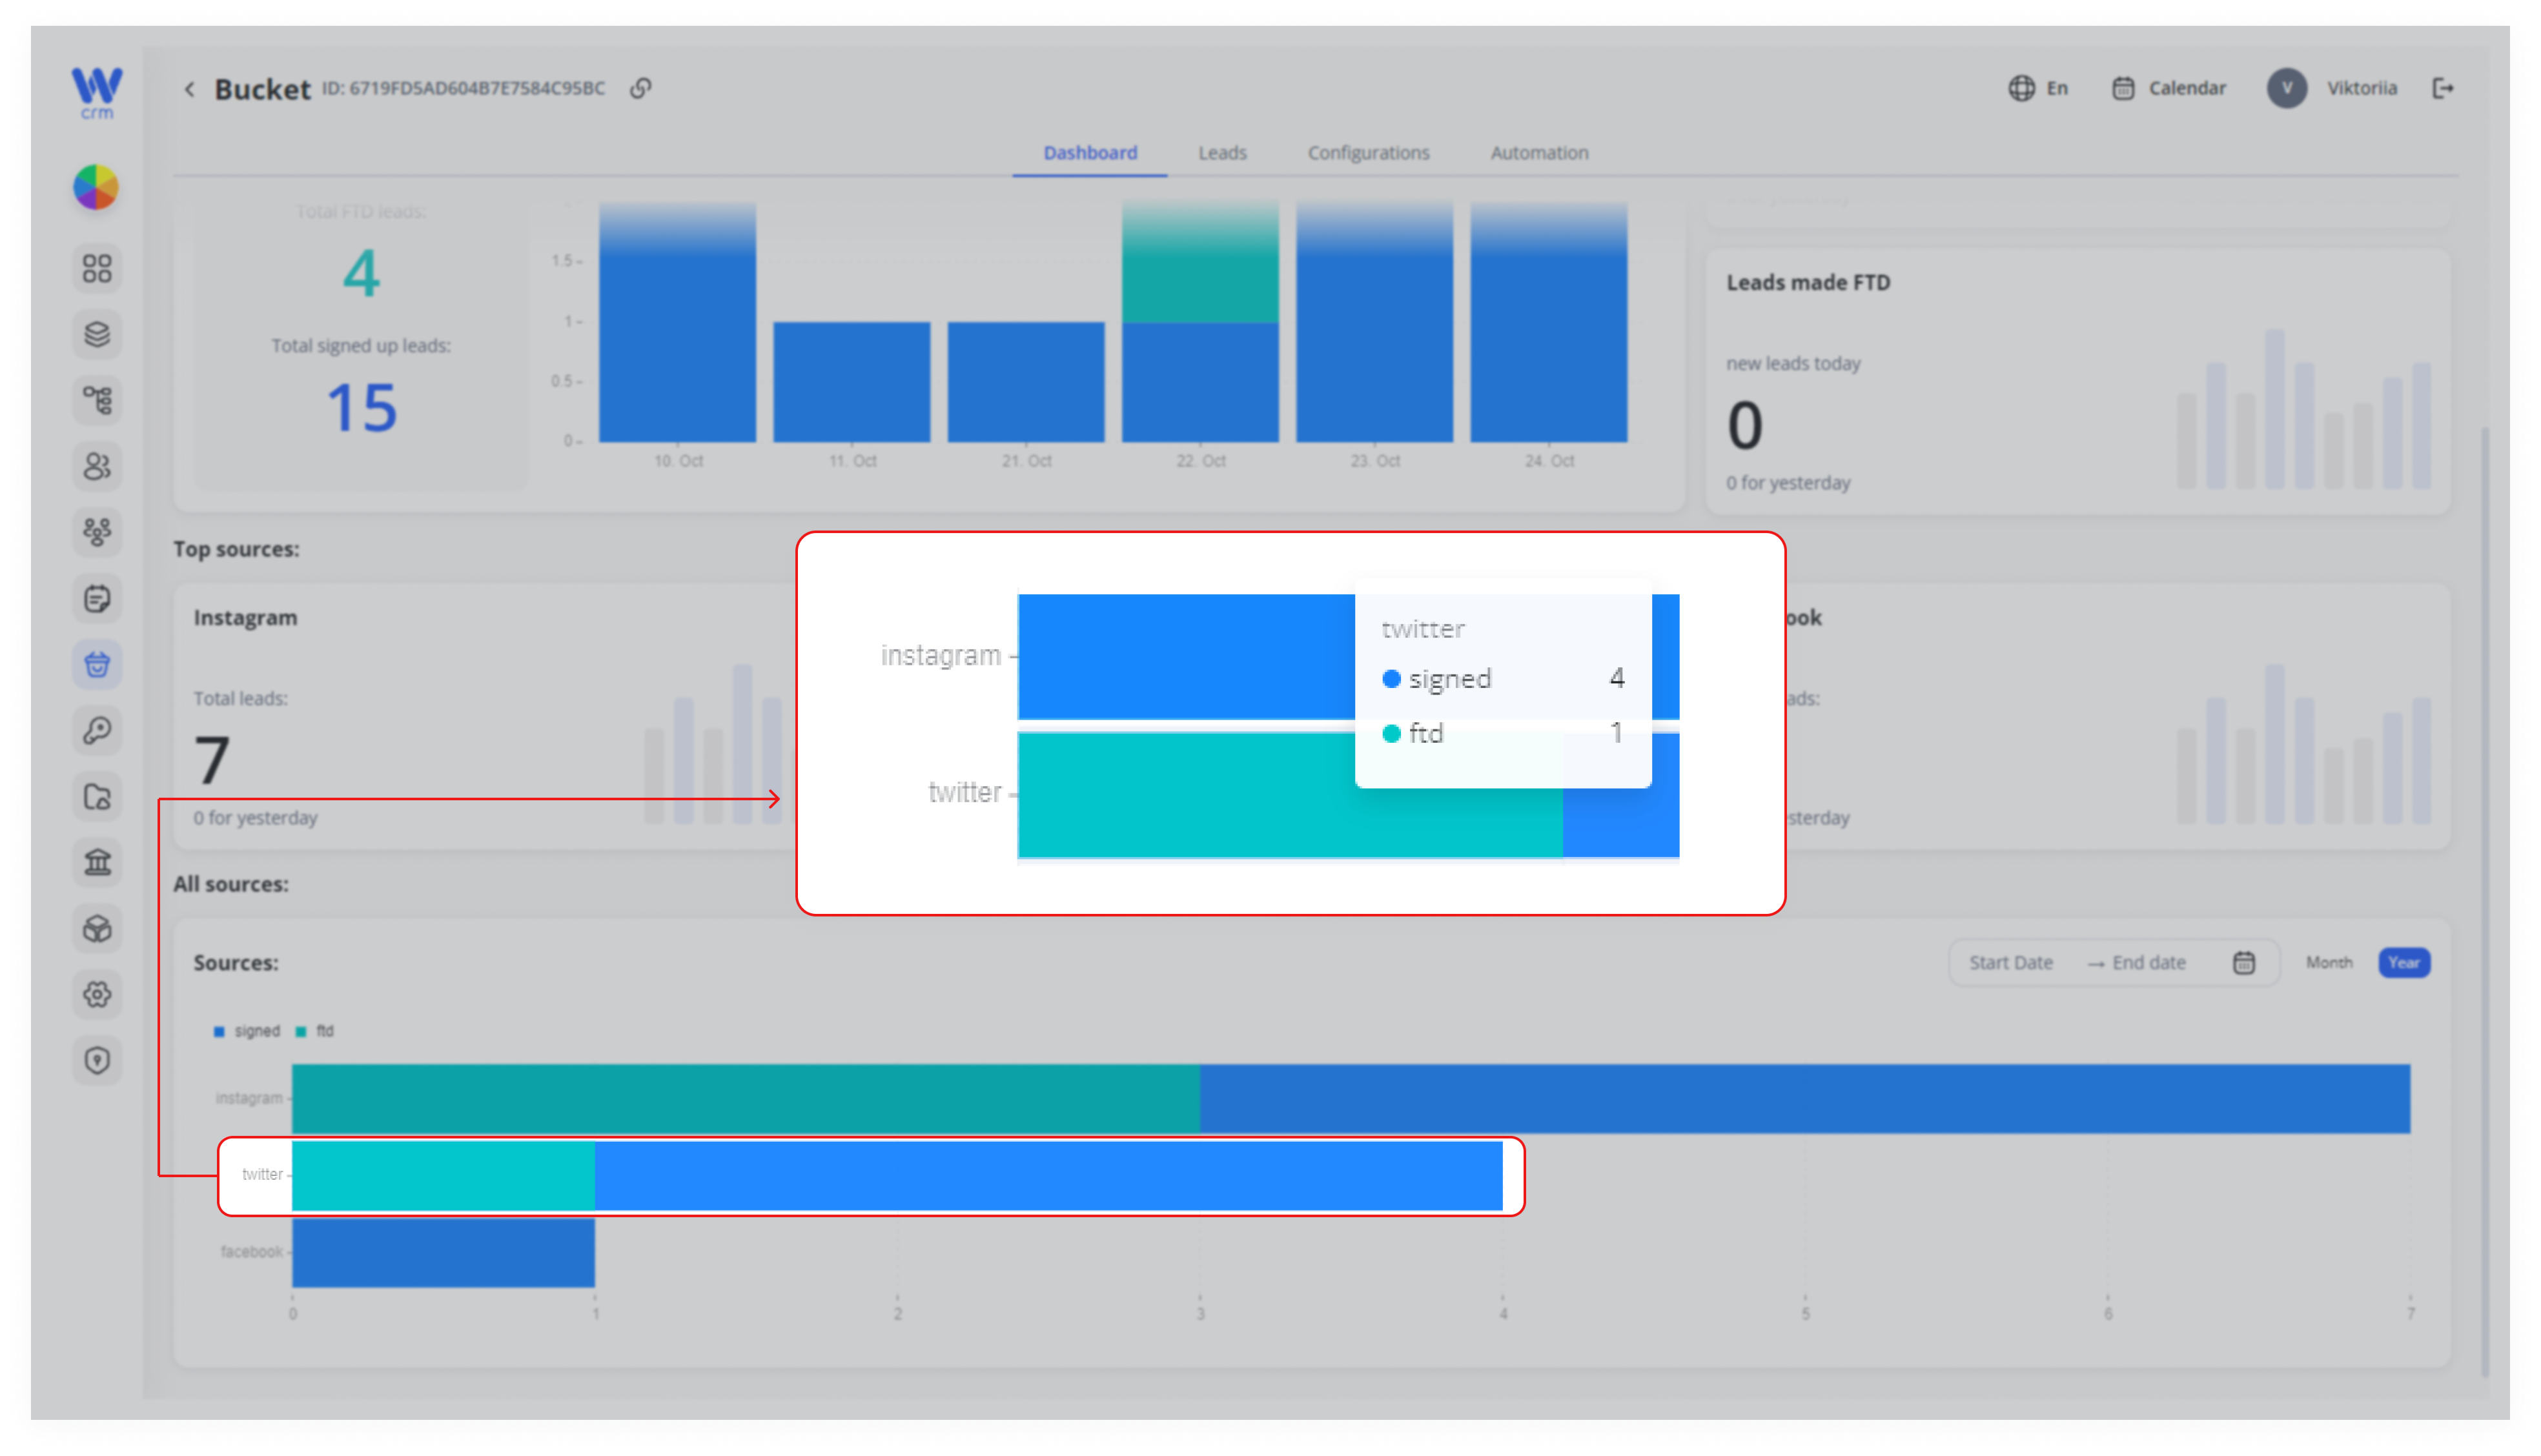
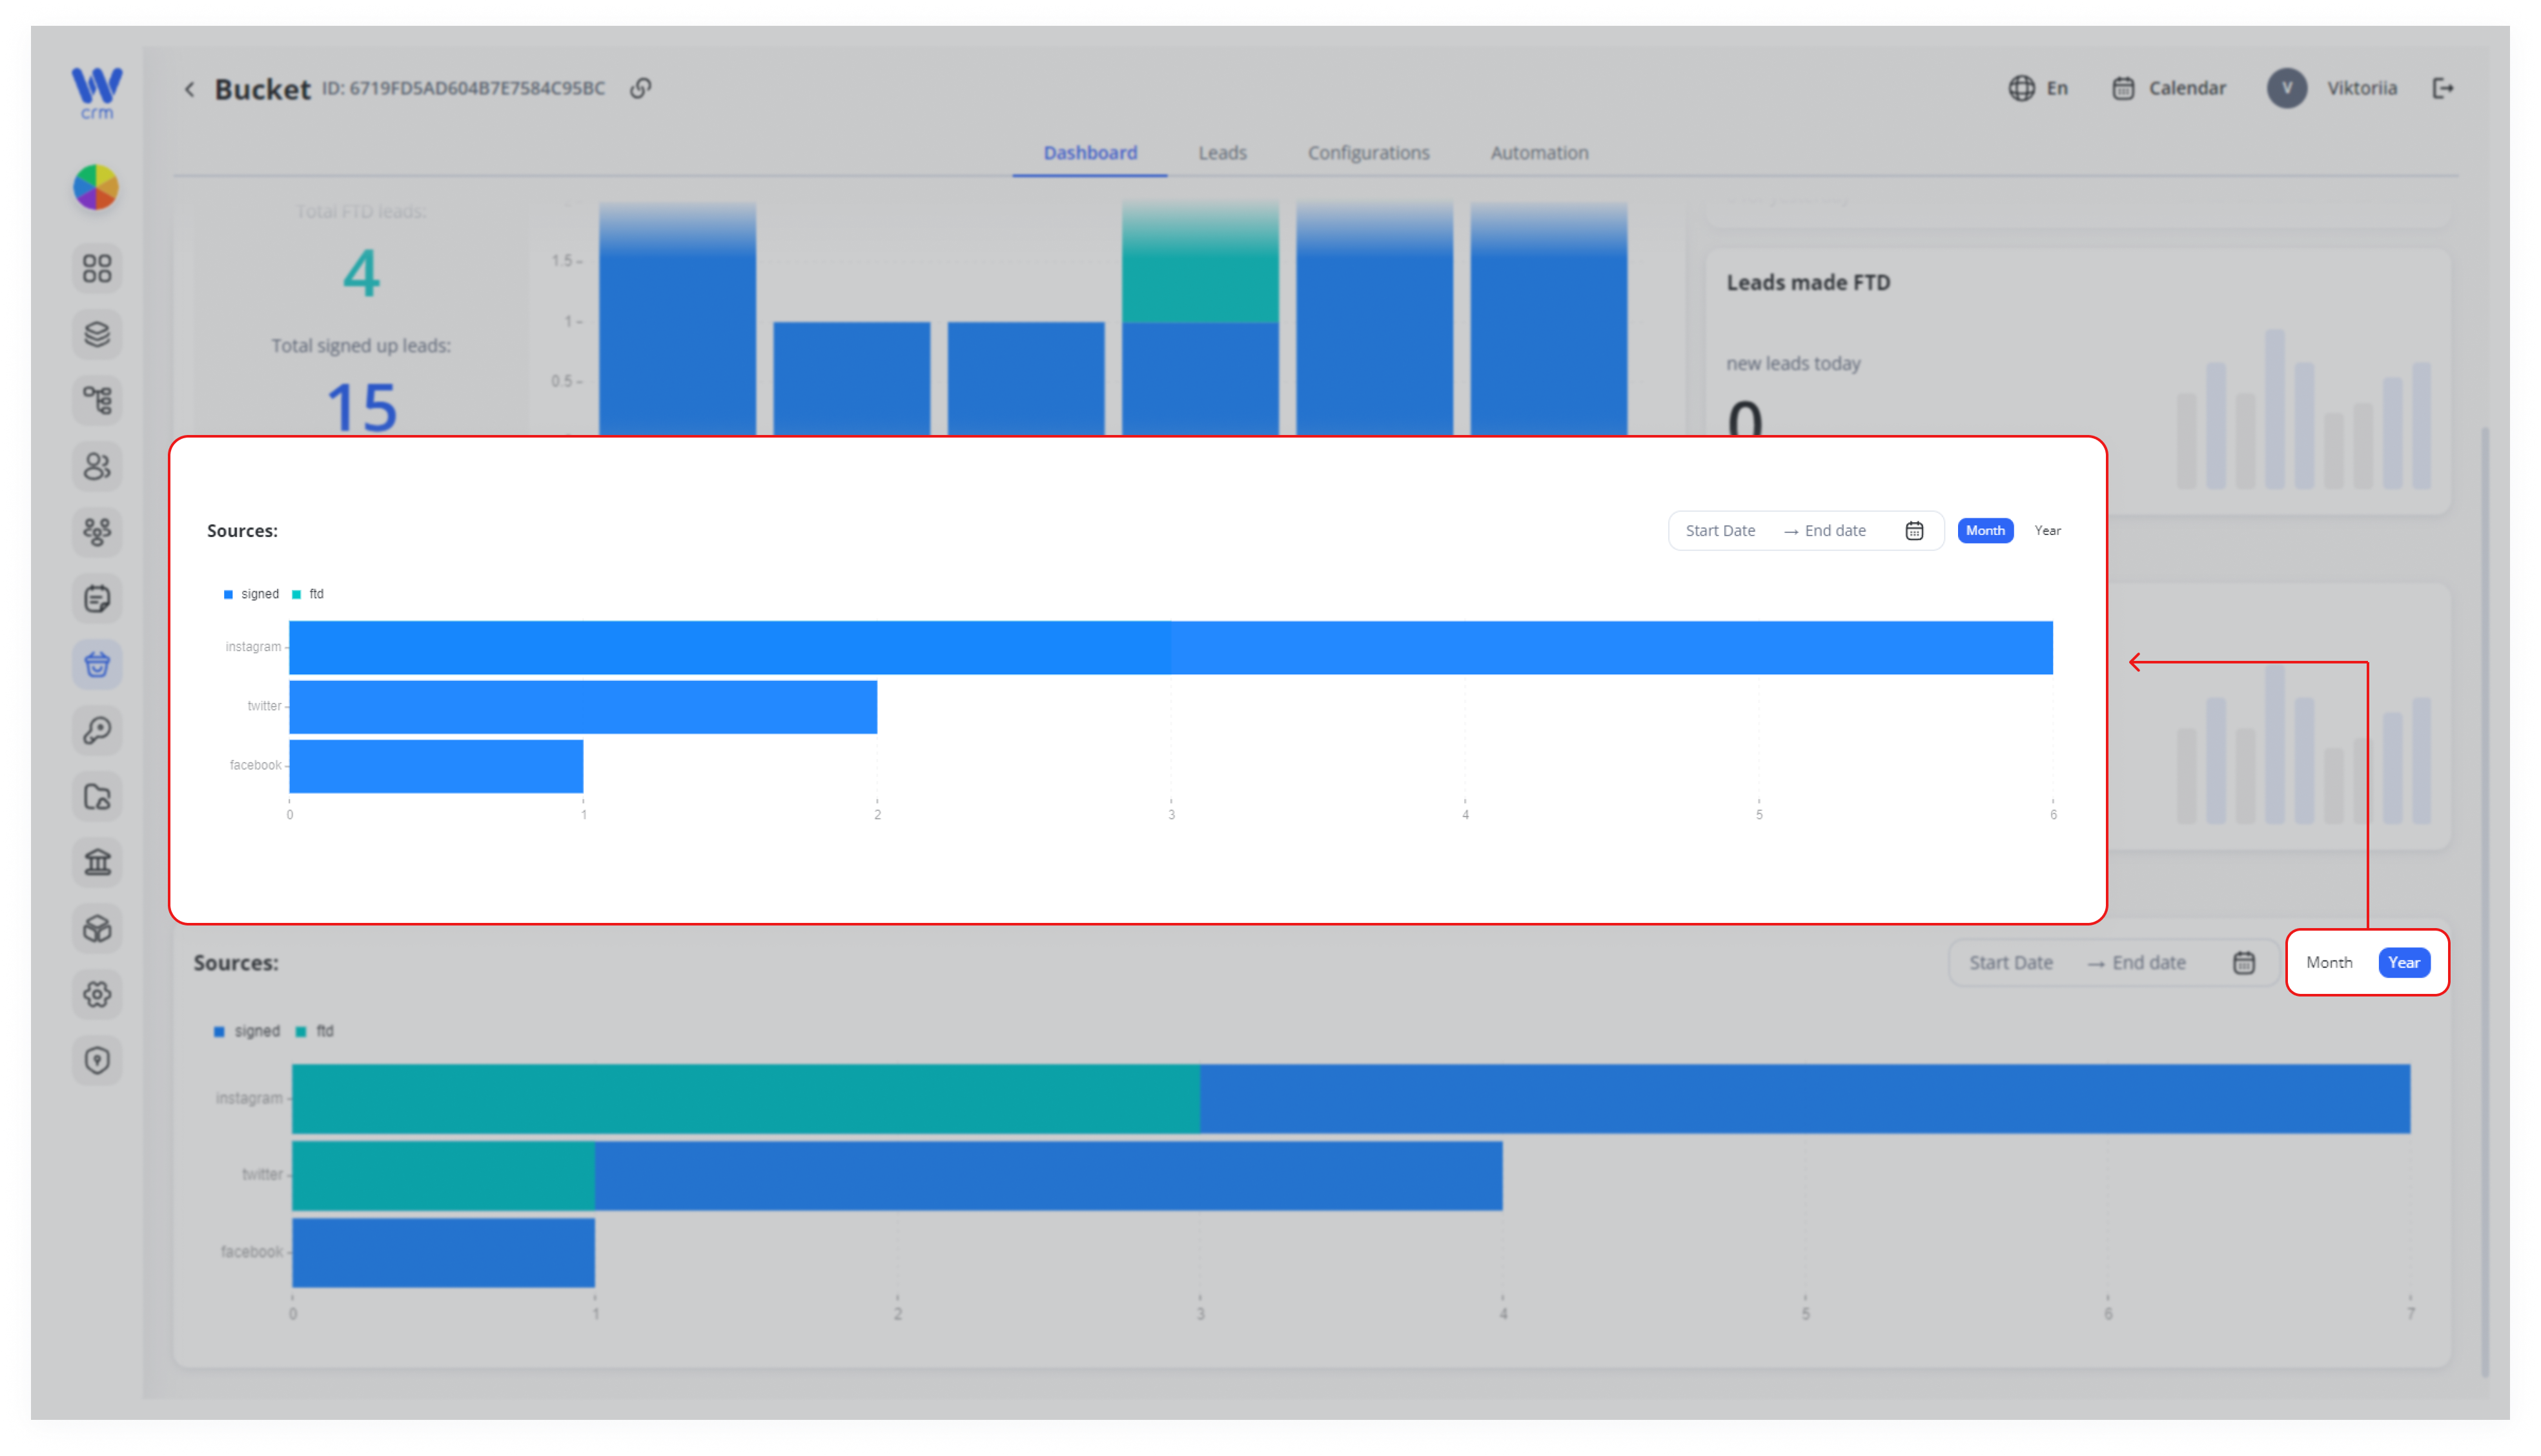
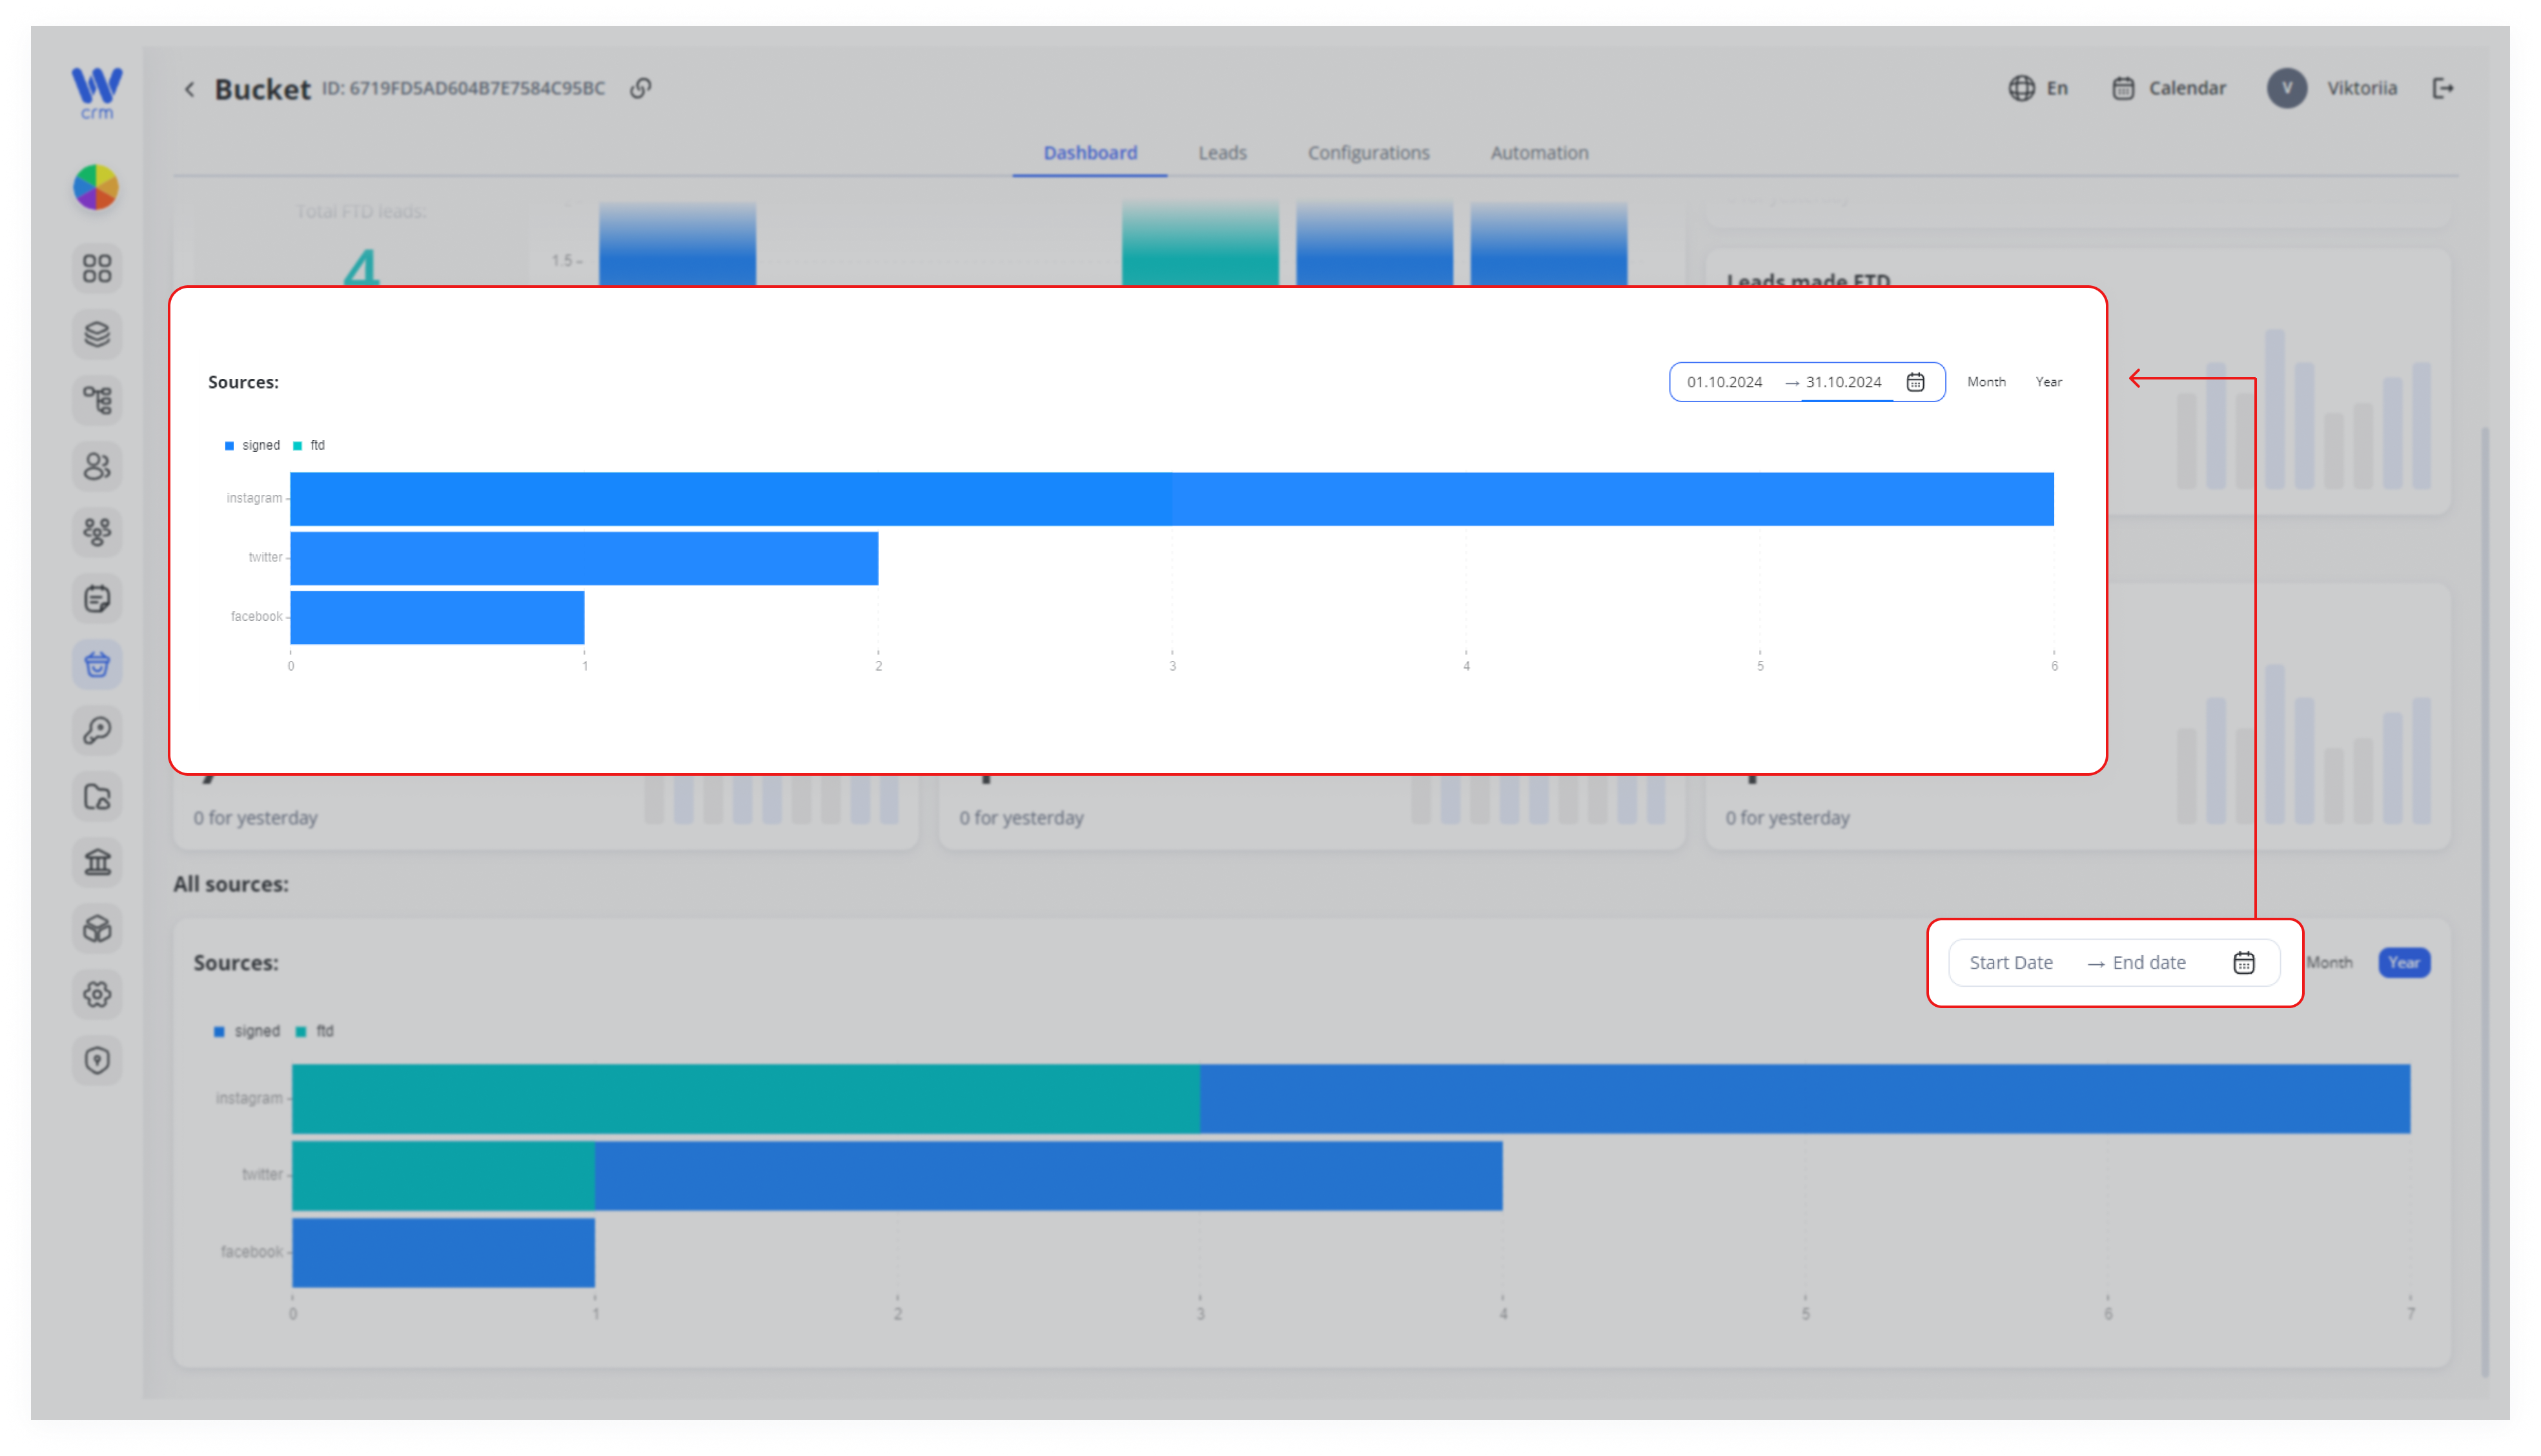
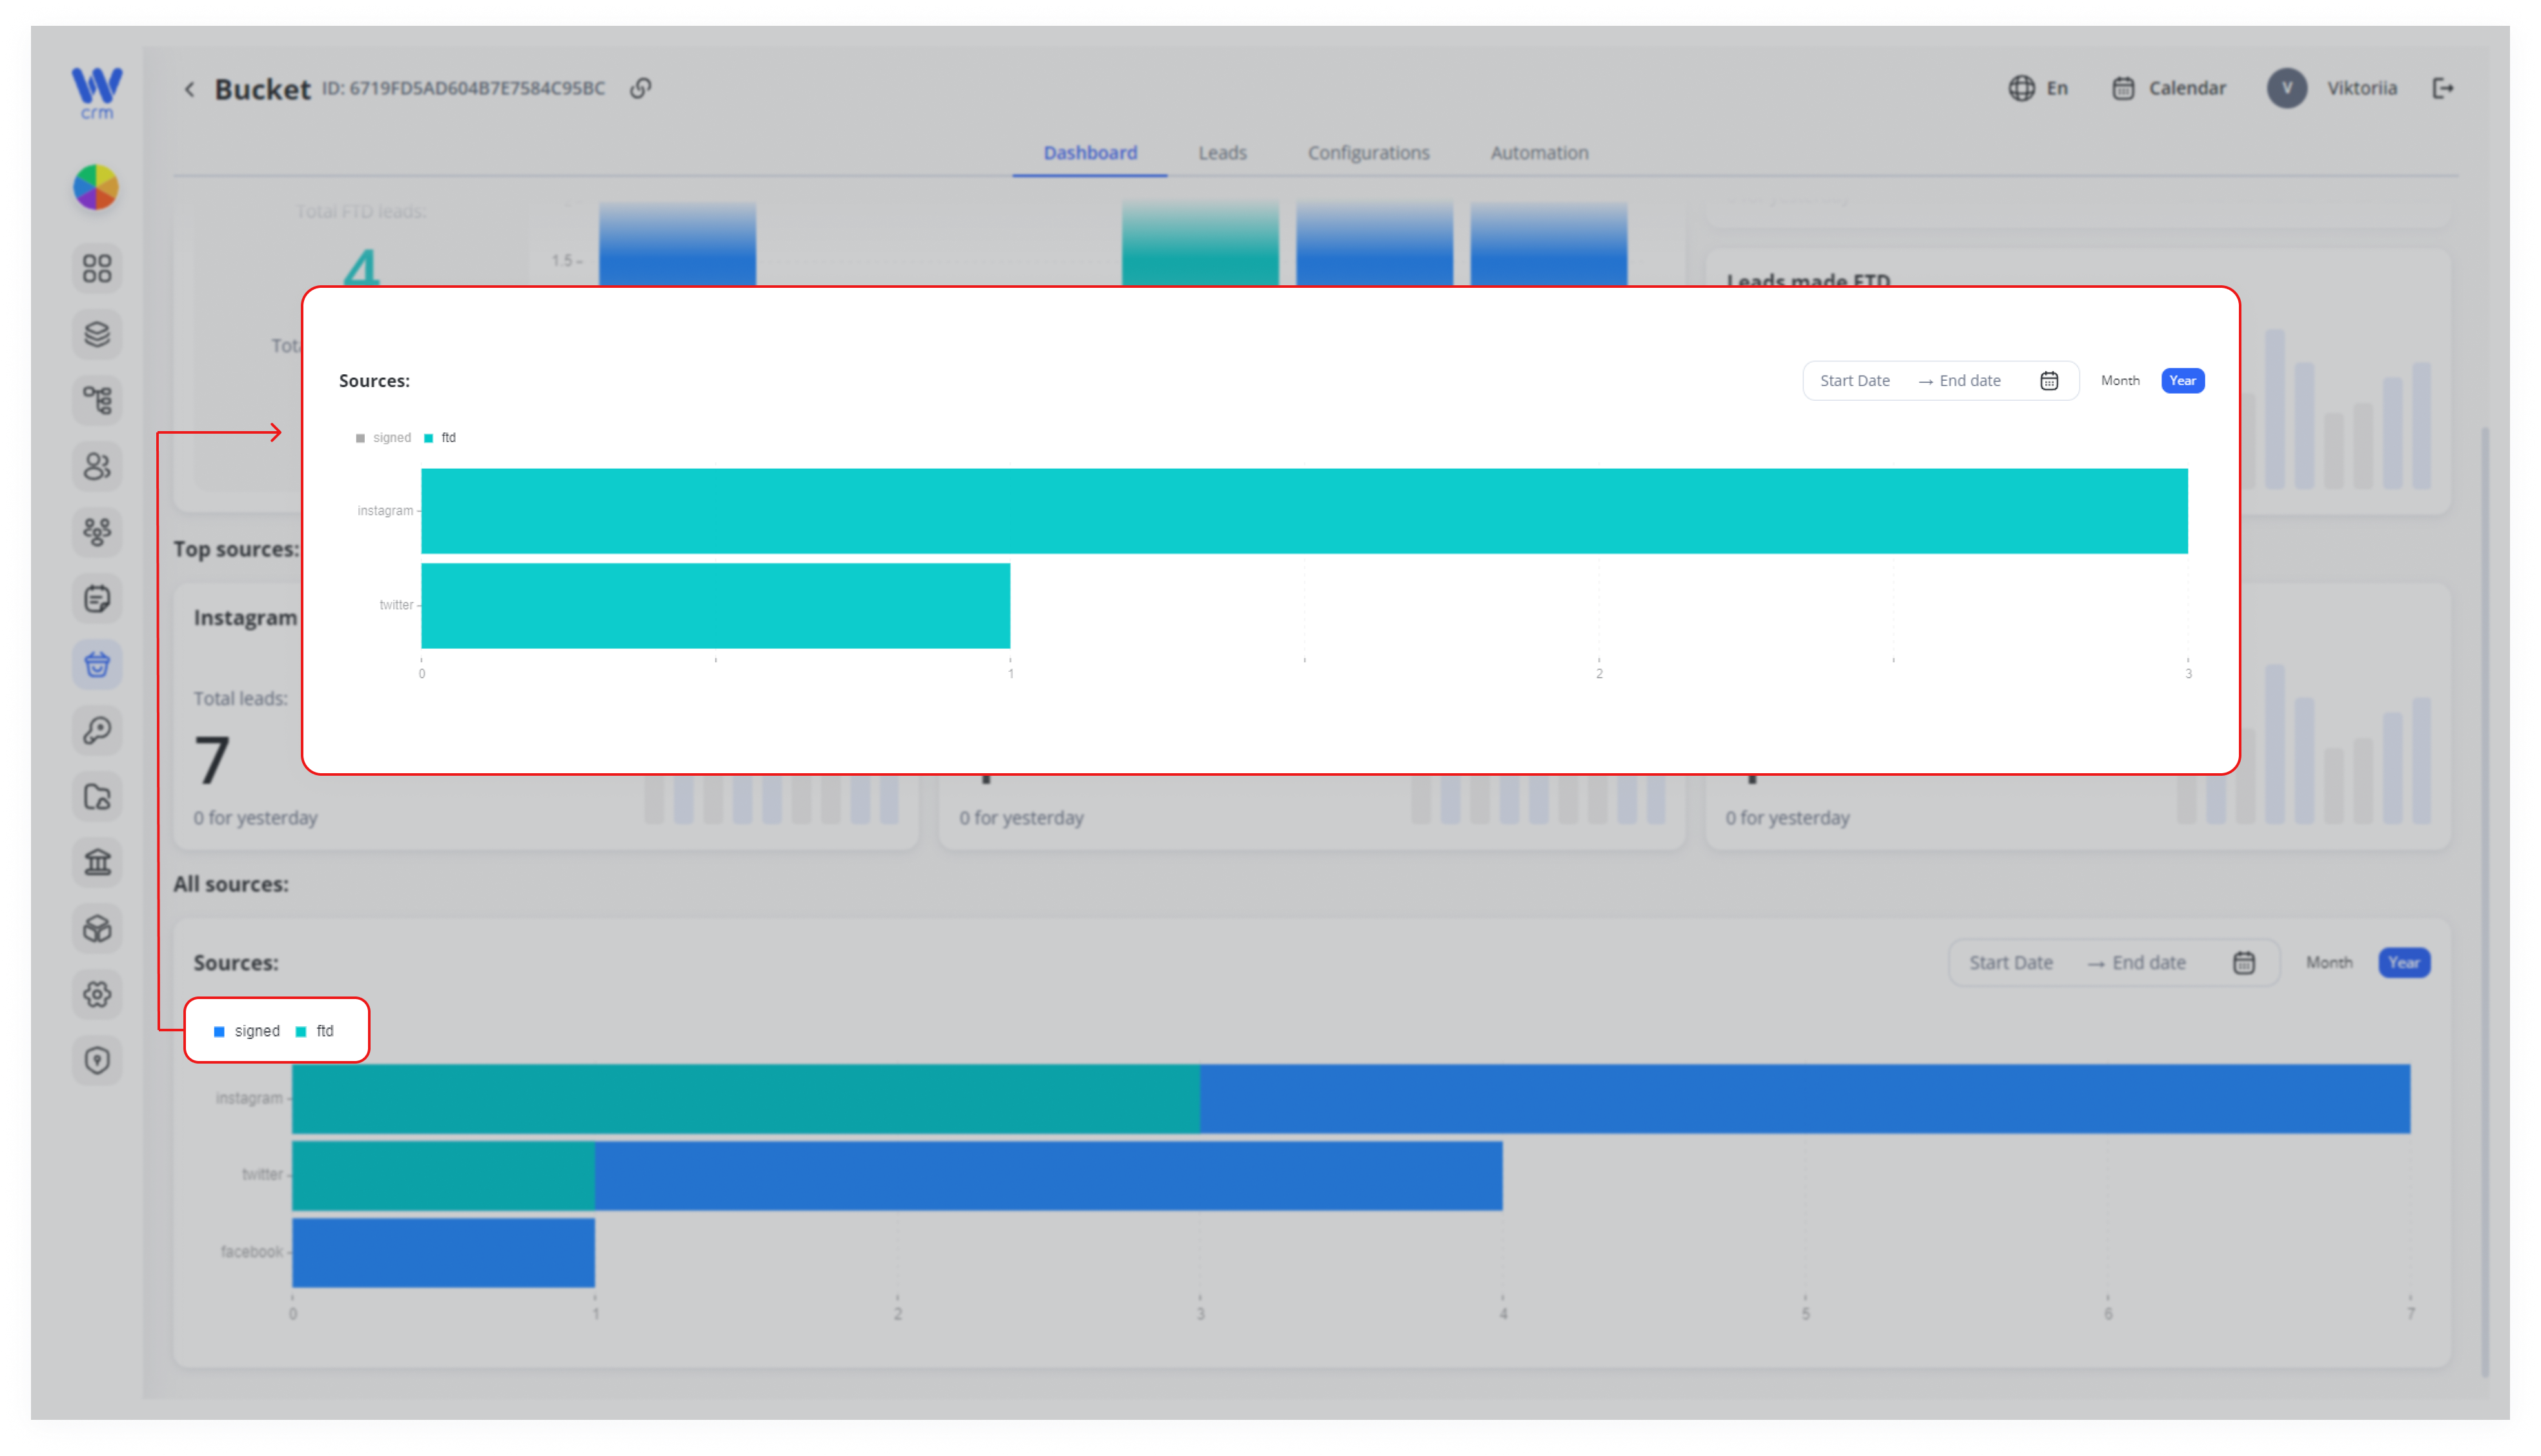
To see more detailed analytics by source, scroll down the page. The All sources block with information about leads from each source will be displayed. In this block, you can:
Choose which data to include in the chart: Month or Year.
Customize the time period for which you are viewing the data.
Display data for signed up leads only or FTD leads only.
Also, when you hover over a specific bar, the number of leads from that source for the selected period will appear.